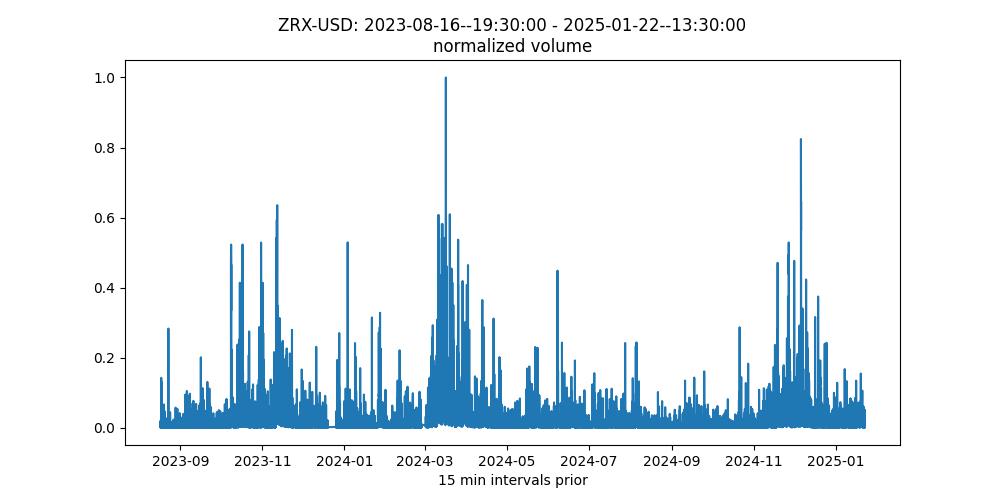
Welcome to cryptoforecasts.net, providing short term crypto price forecasting for popular high volume assets on USD markets. Price and volume data are pulled in 15 min increments for the last few weeks and price predictions are computed for approximately 1.5 days ahead.
An optimized multivariate time series and an ML based model are used for prediction, utilizing price, volume, and volume weighted average price information, using level set and log differenced data. Please note that model predictions are not guaranteed in accuracy and use them at your own risk.
Please support this website. We need to raise funds to buy better computing equipment for running state of the art time series analysis and prediction algorithms (e.g. LSTM forecasts).
If we can raise some funds, these new plots and commentary will be added to the site. Updated plotting and more compute intensive models (May 2026).
BTC/SOL/XRP analysis with VAR/VECM/CNN/LightGBM predictions.
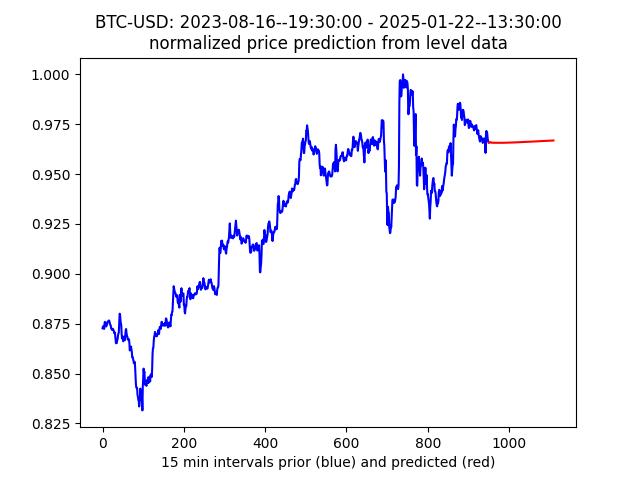
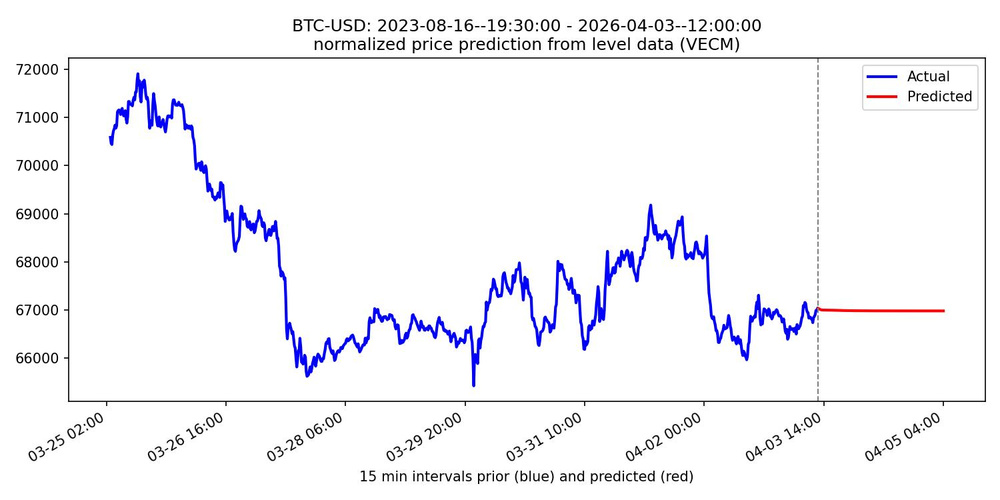
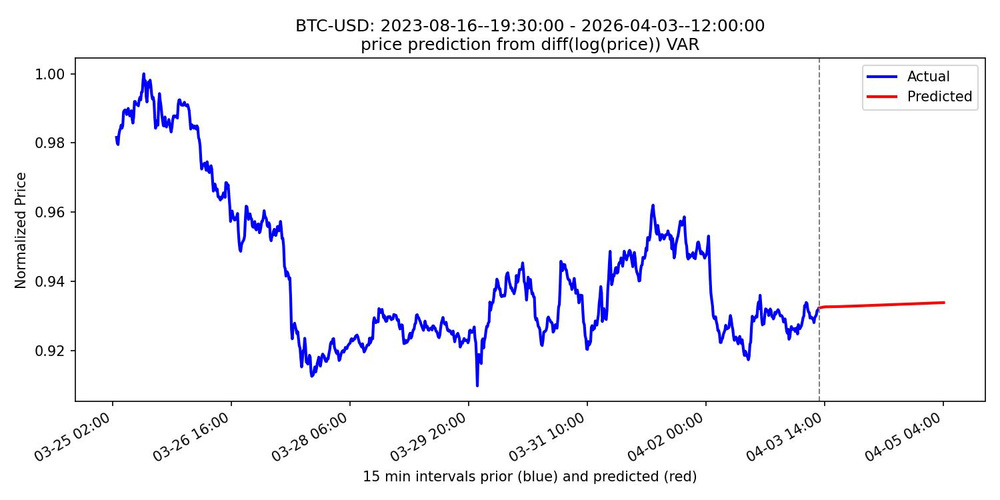
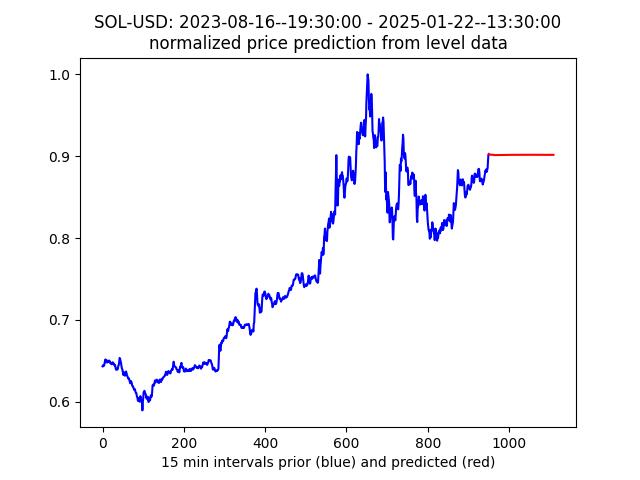
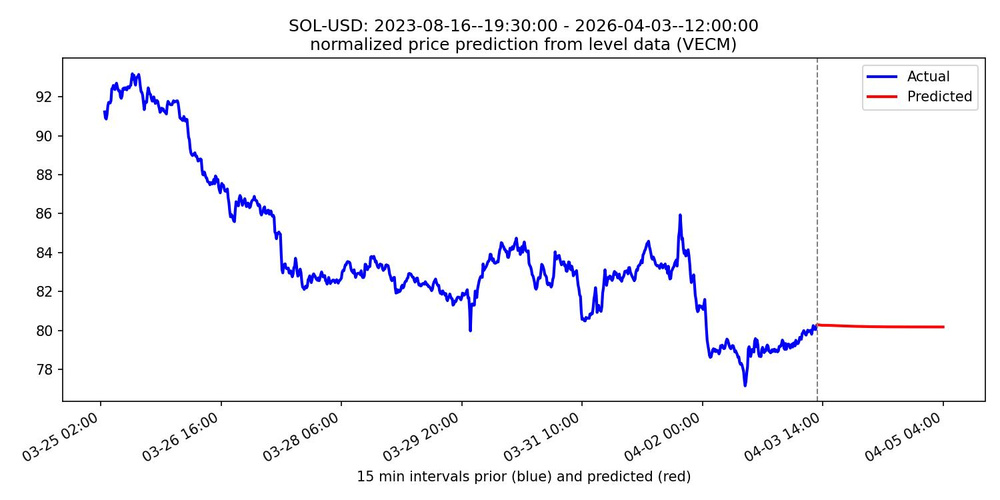
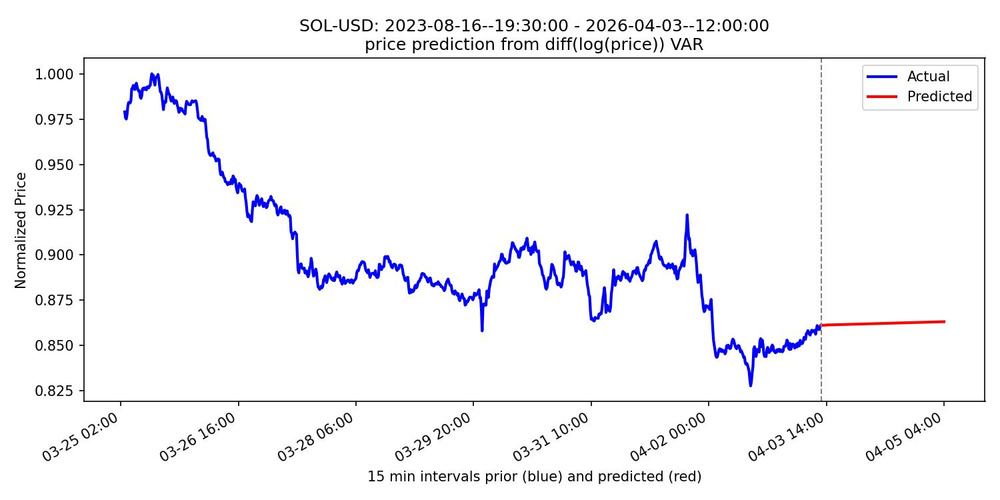
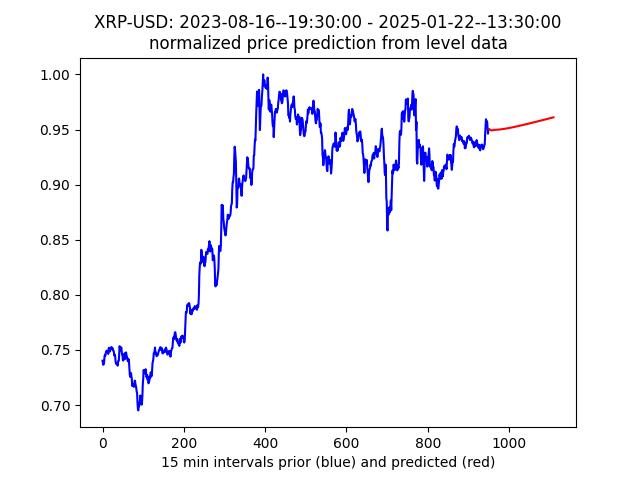
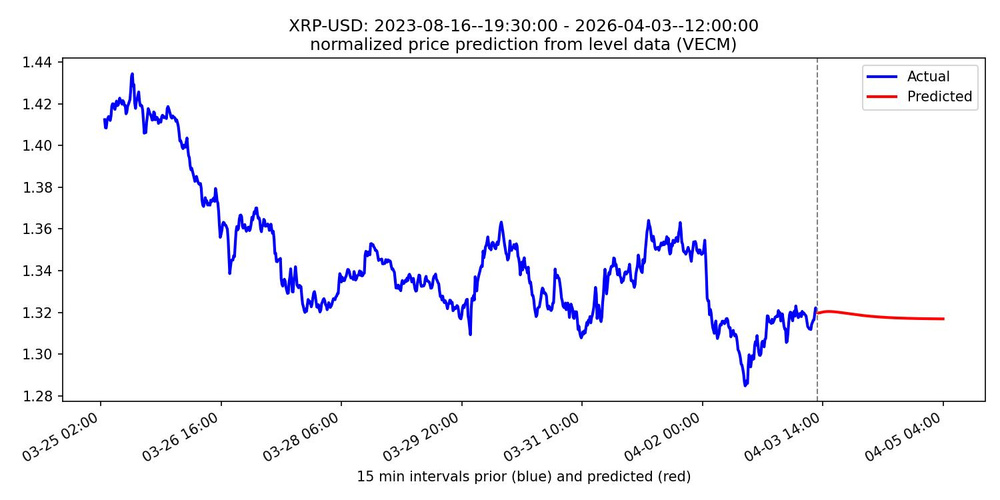
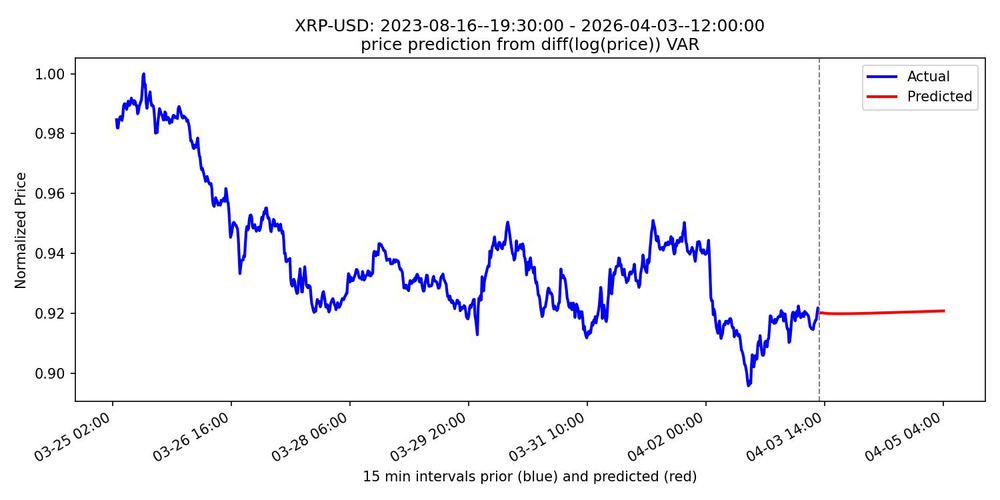
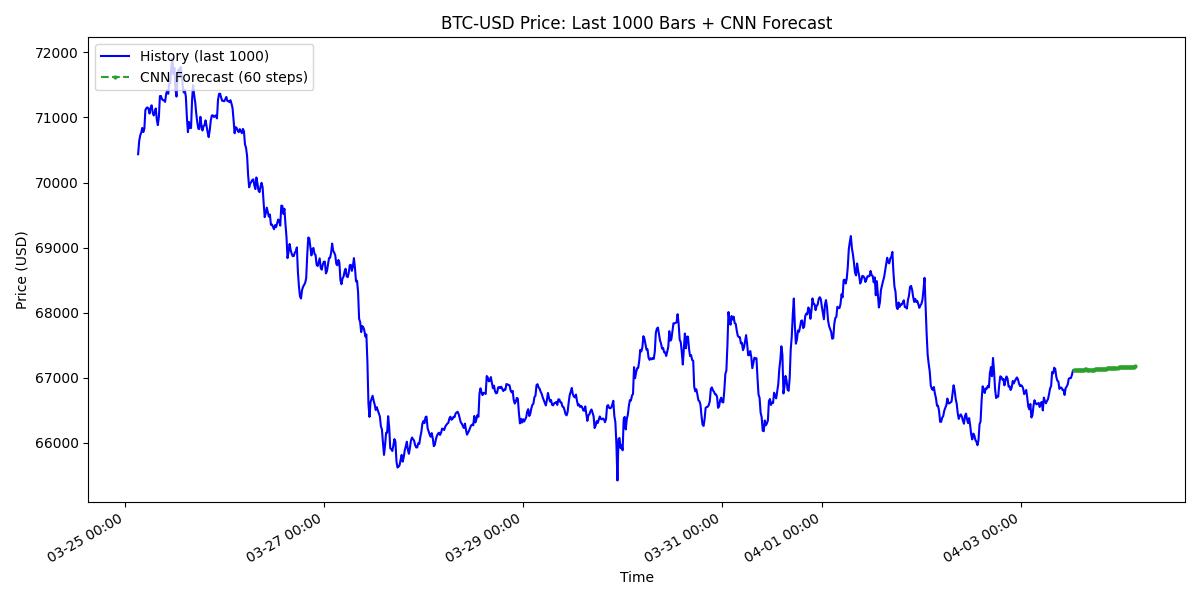
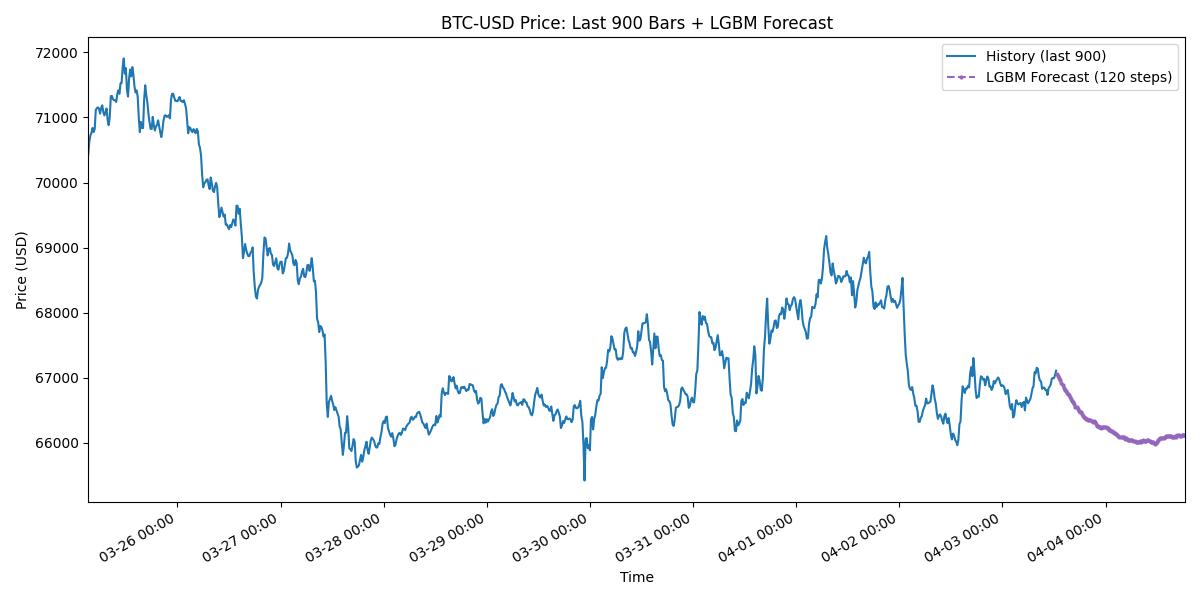
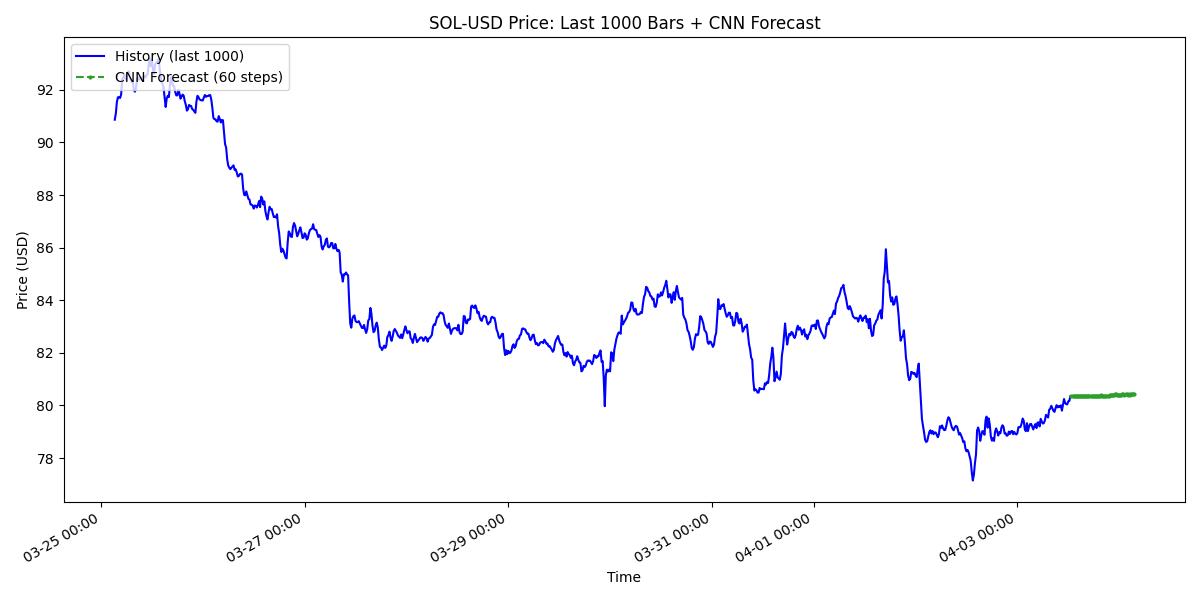
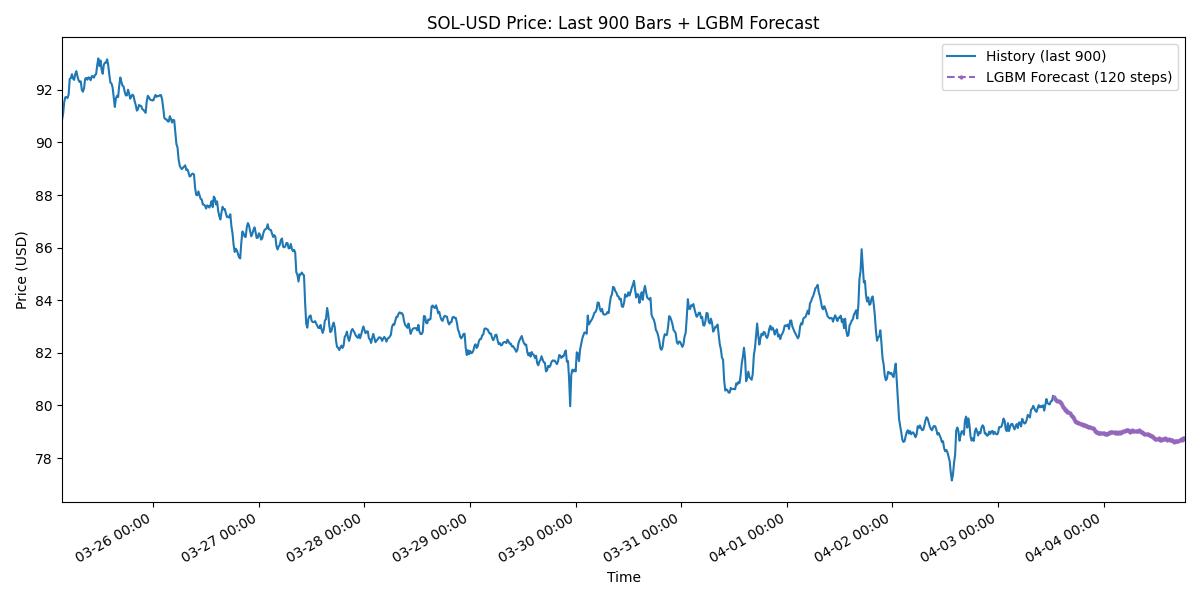
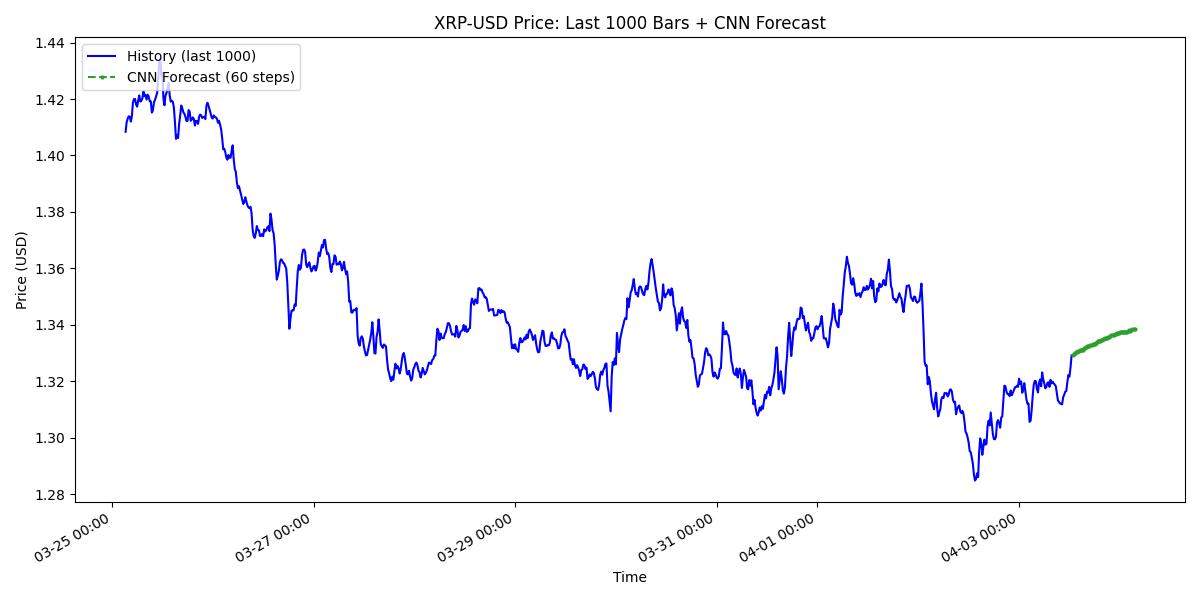
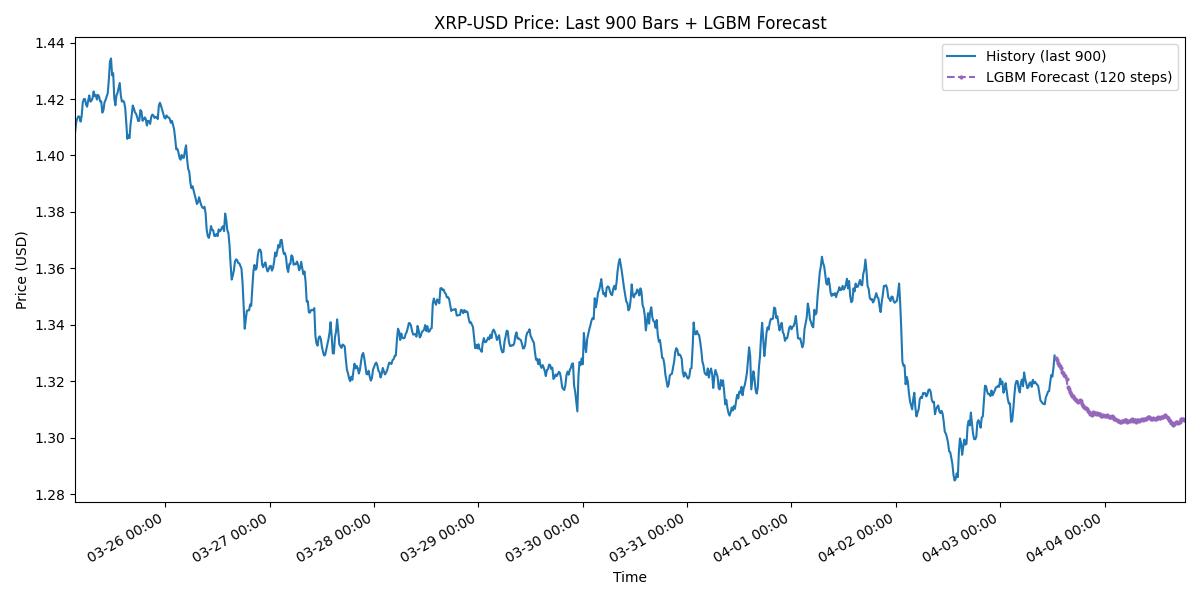
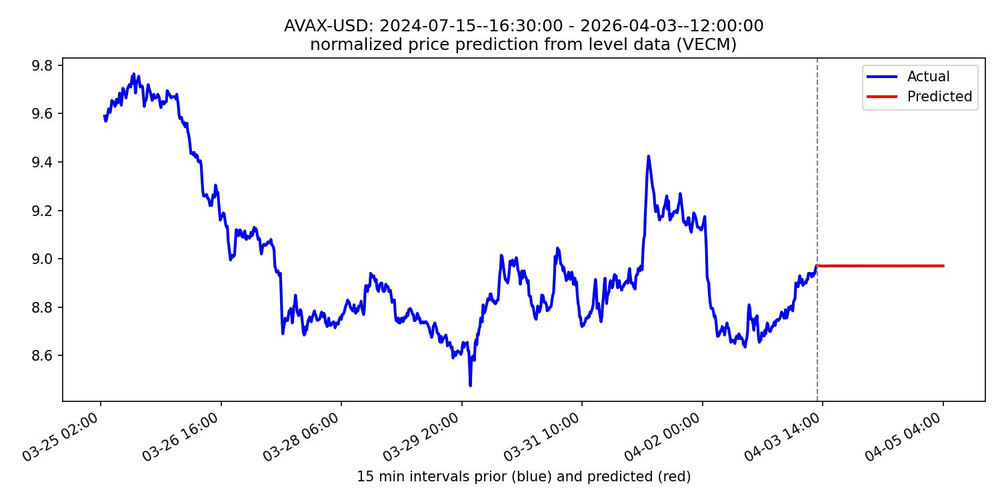
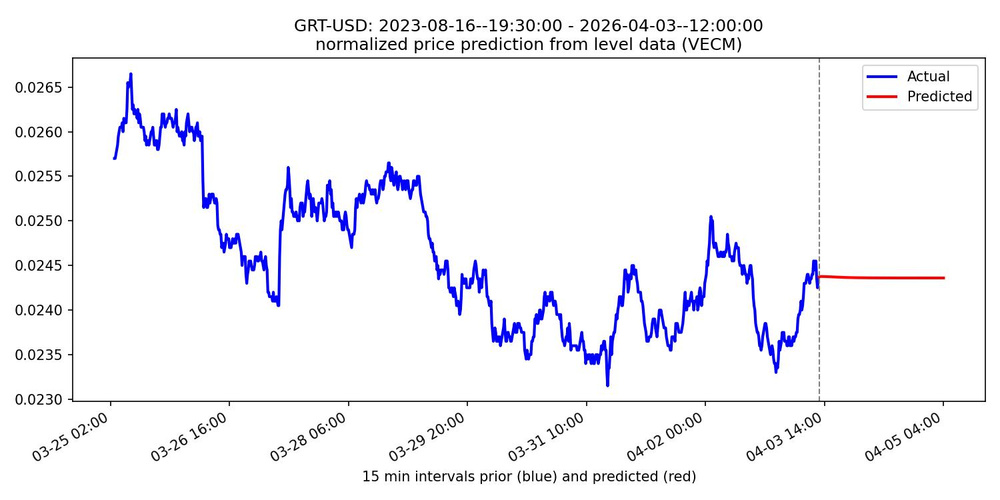
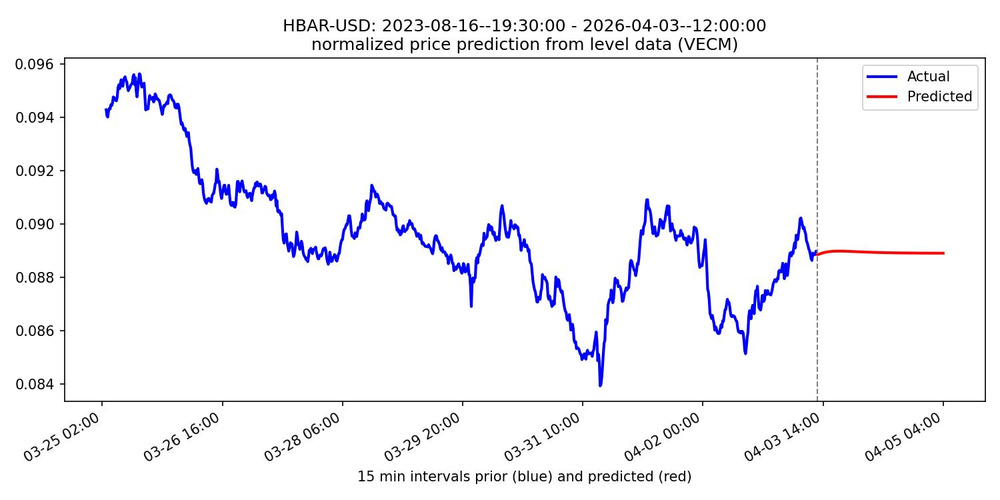
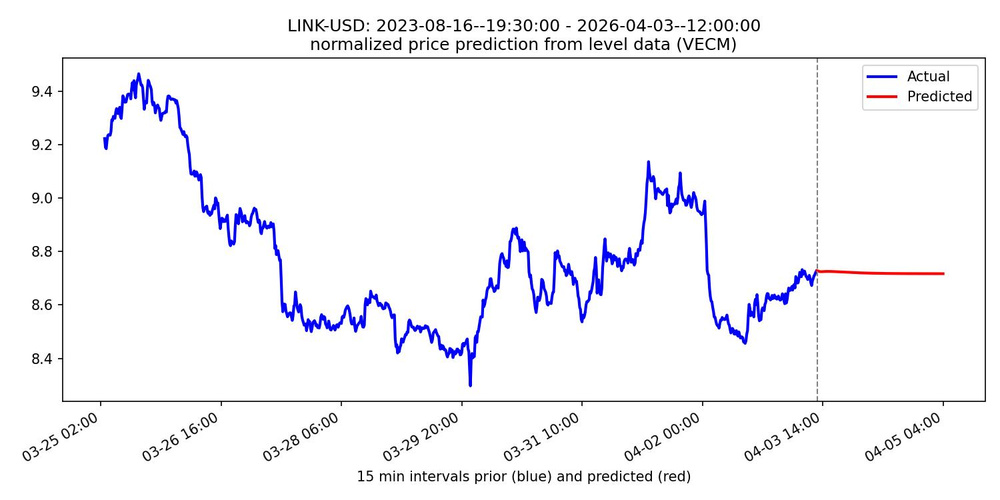
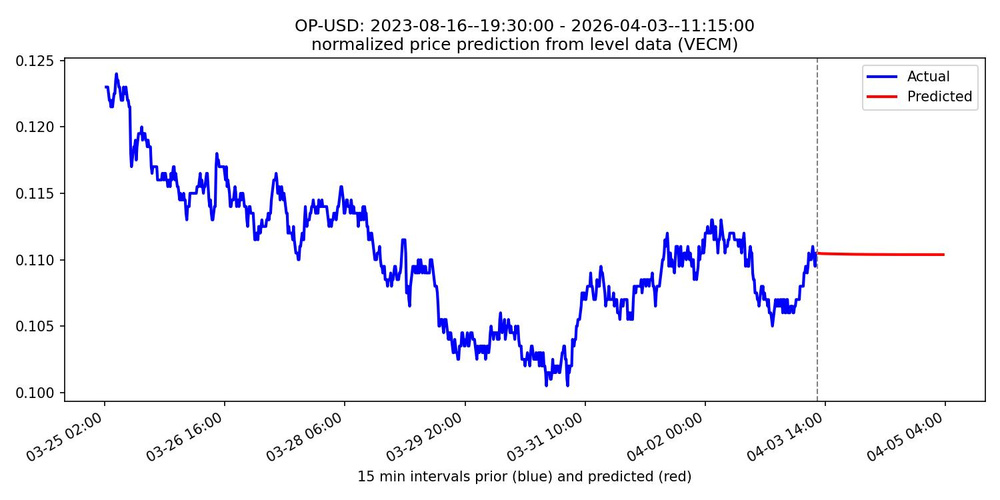
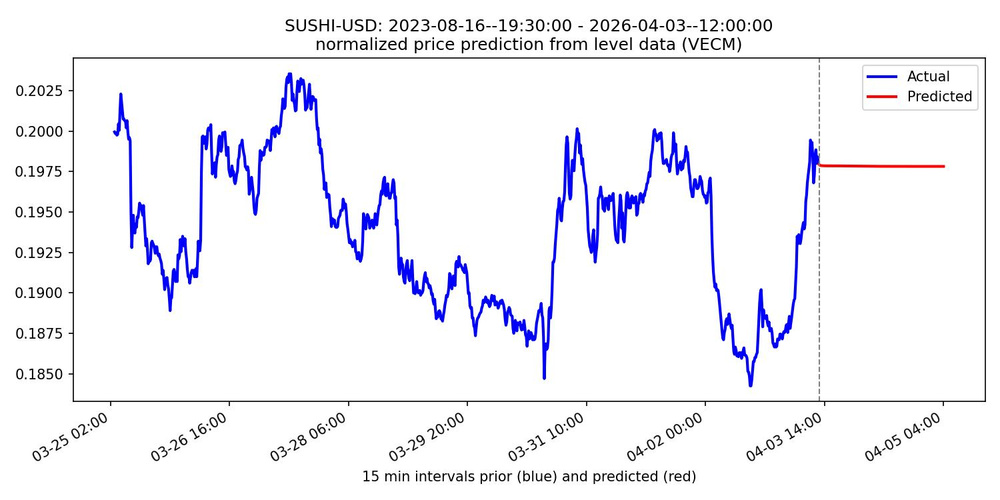
Below are plots for VAR and VECM model results for BTC, SOL, and XRP. Prediction direction for these three pairs often reflects the overall near term price movement direction. We also plot ML predictions for
BTC-USD, SOL-USD, XRP-USD over the next 24 hrs using CNN and LightGBM based predictors.
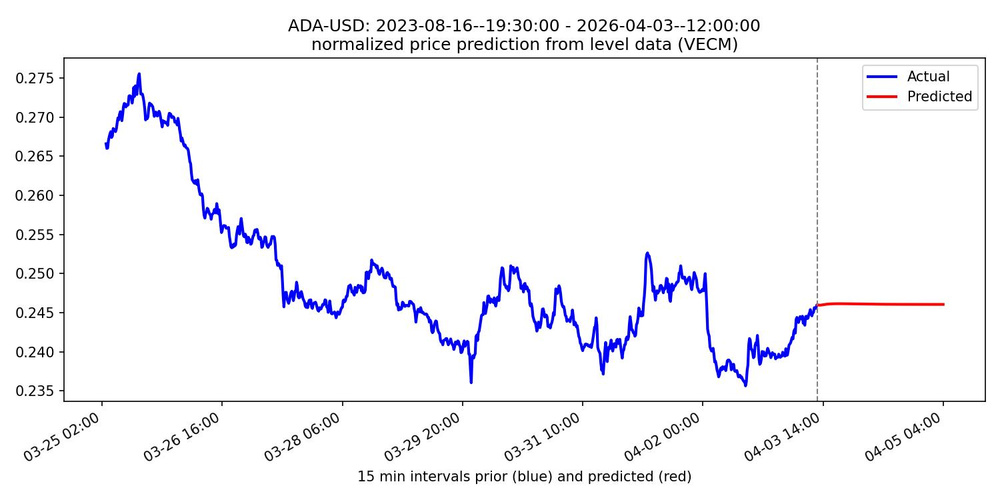
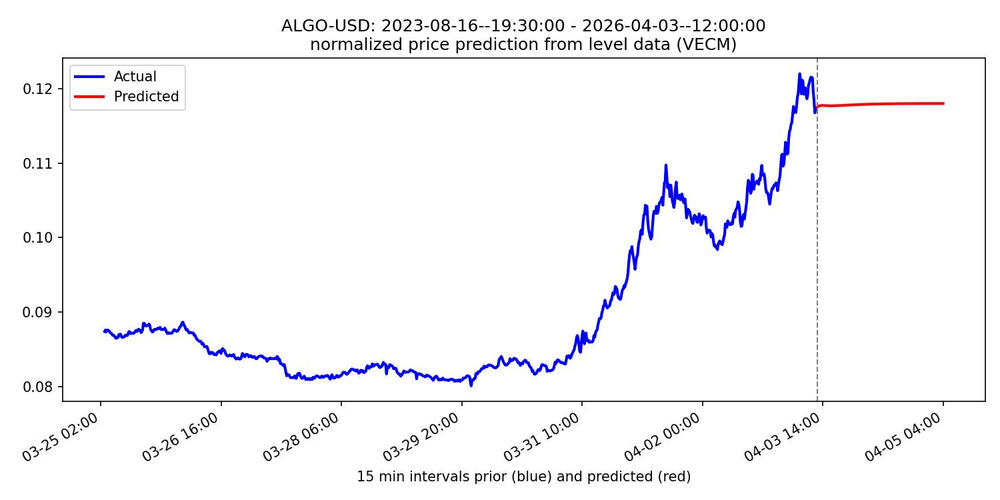
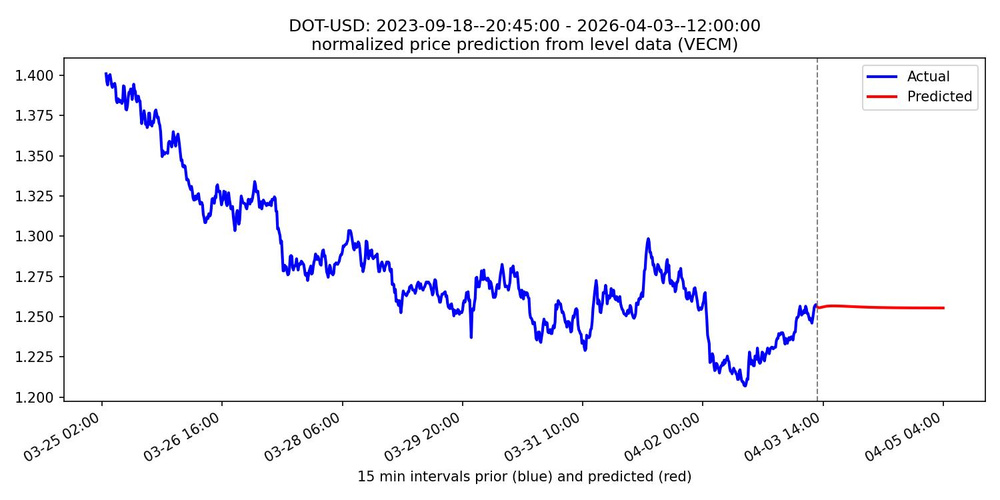
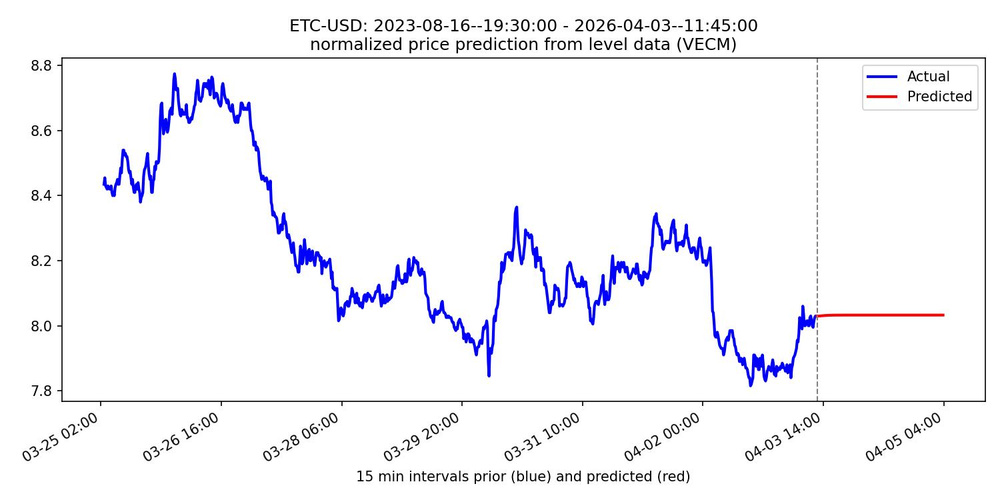
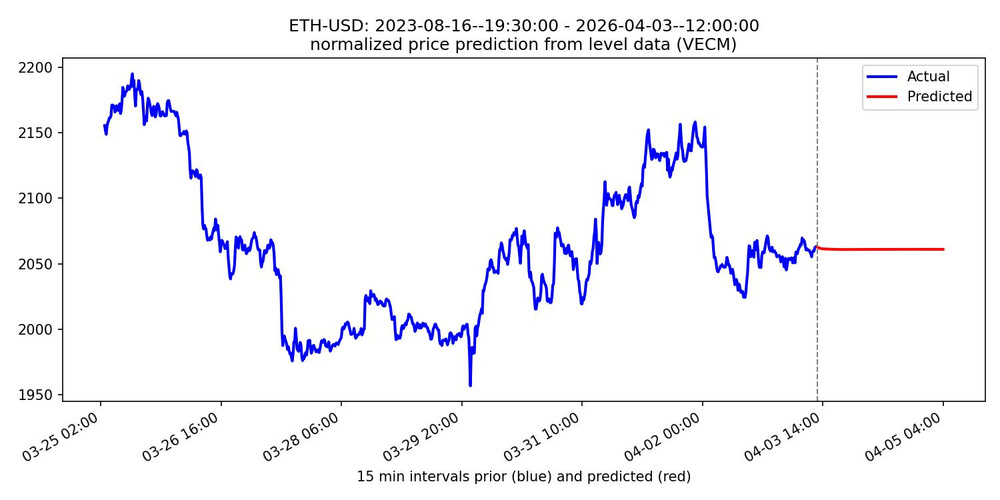
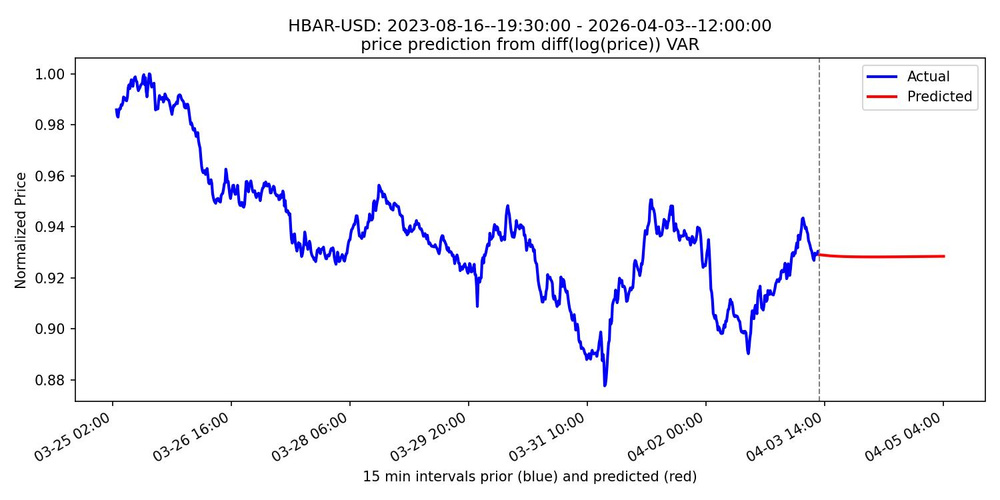
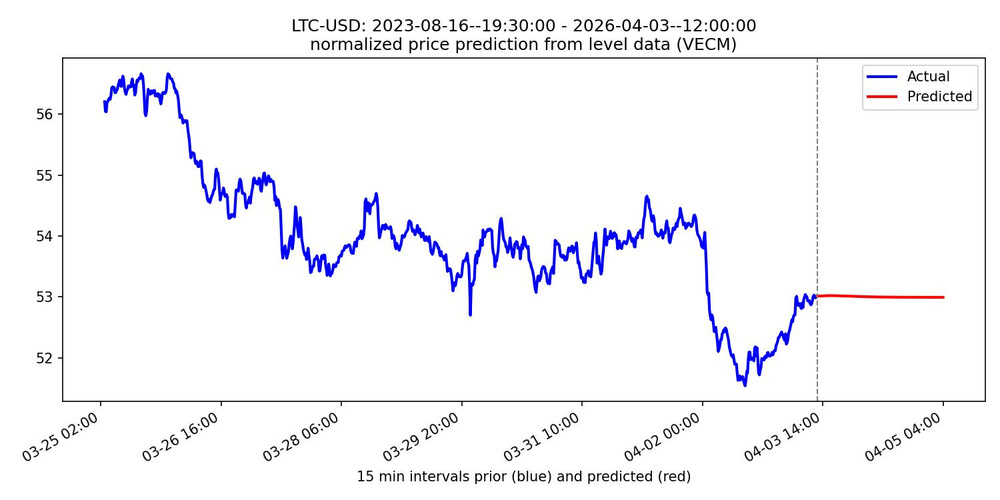
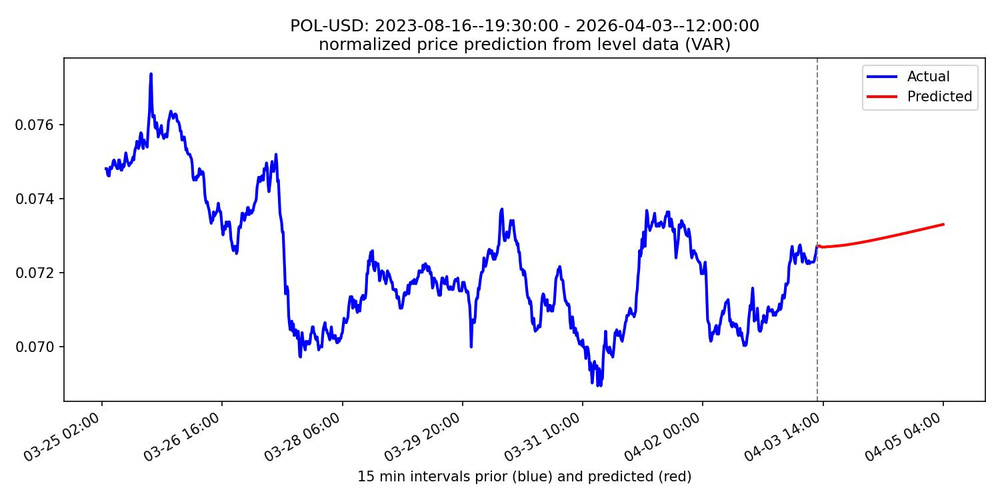
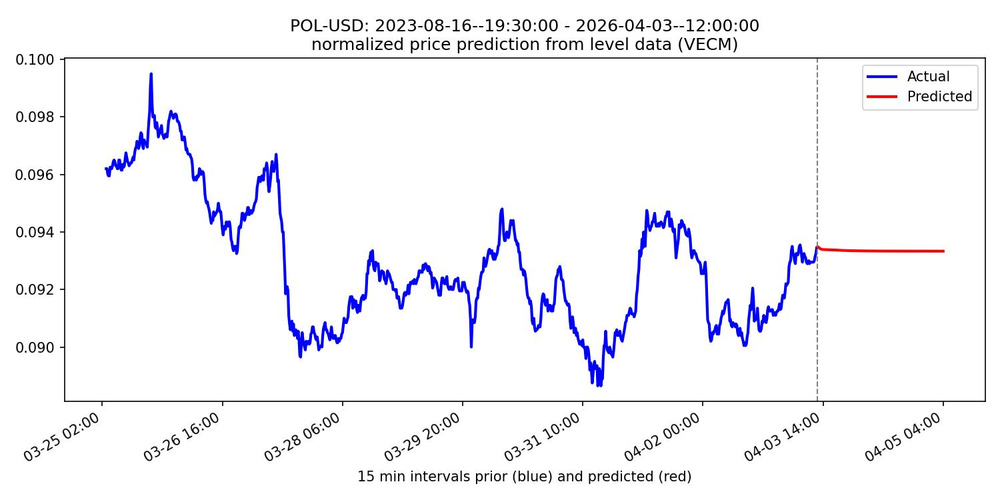
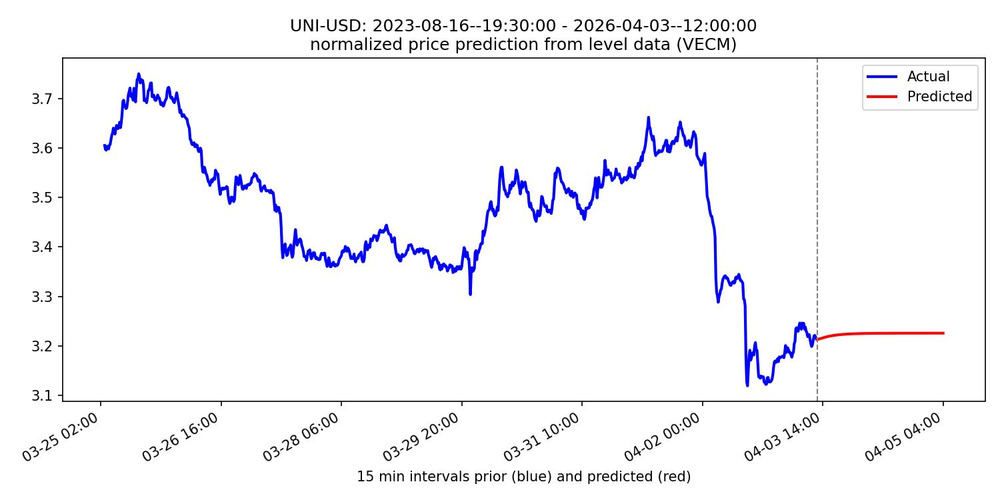
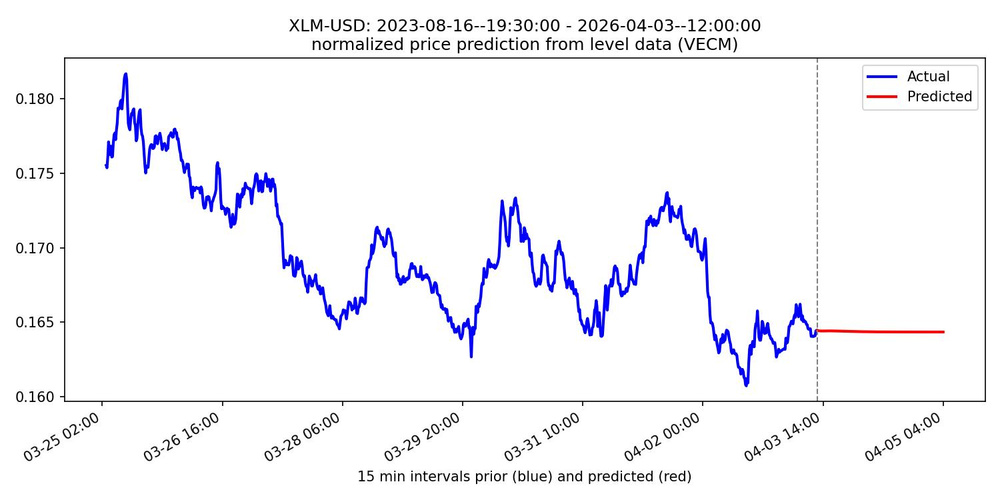
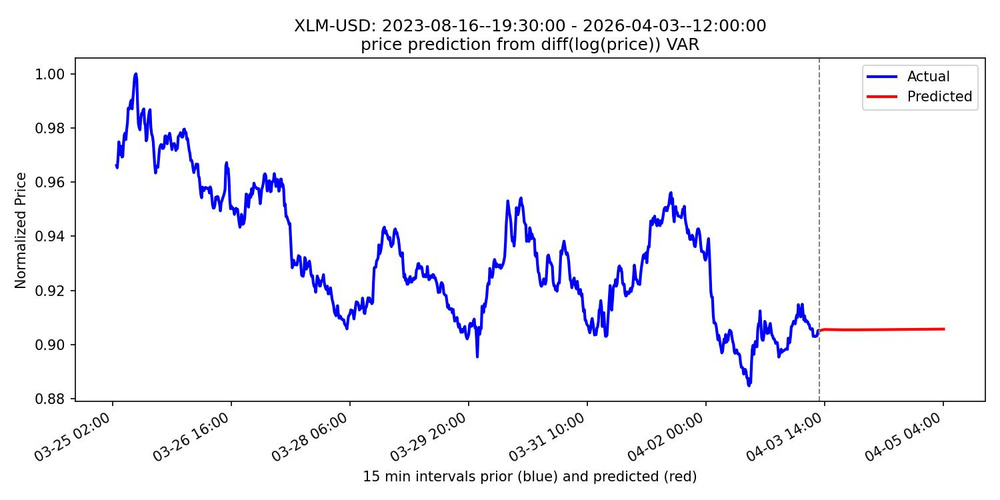
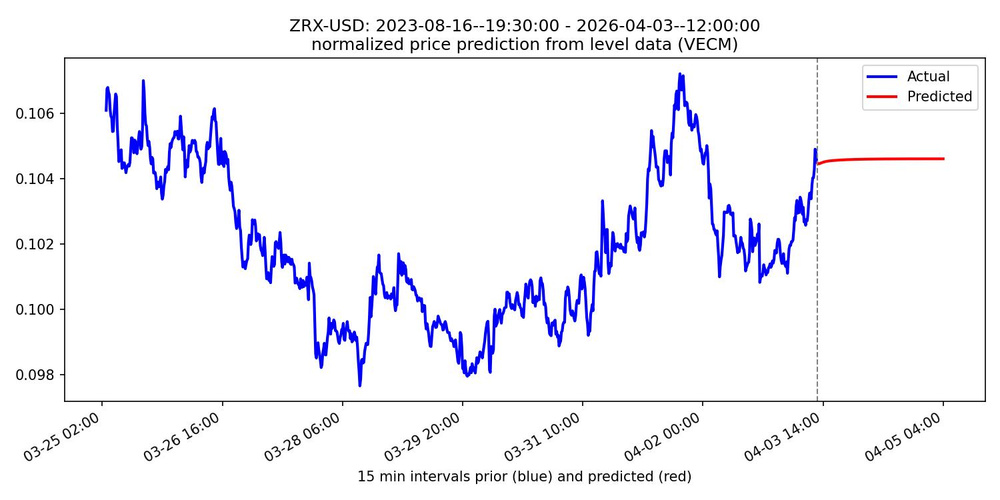
VAR / VECM models
CNN and LightGBM models
Prices for multiple pairs with VAR and MLP based predictions.
Sentiment, Indicators and Prices for the last three days
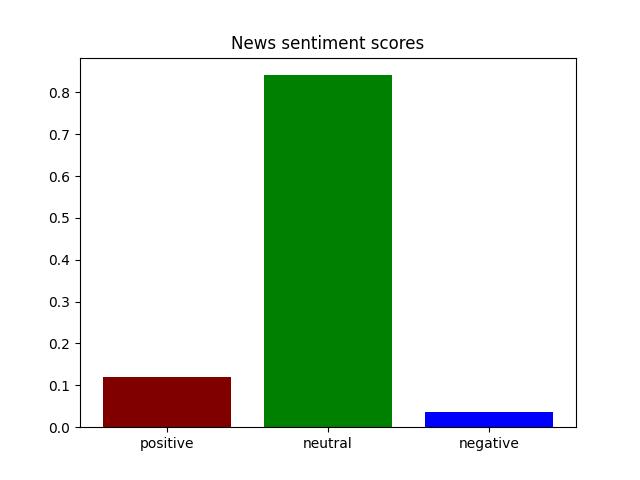
The results of the most recent sentiment analysis of the news feed associated with cryptocurrency based on text from a few major portals.
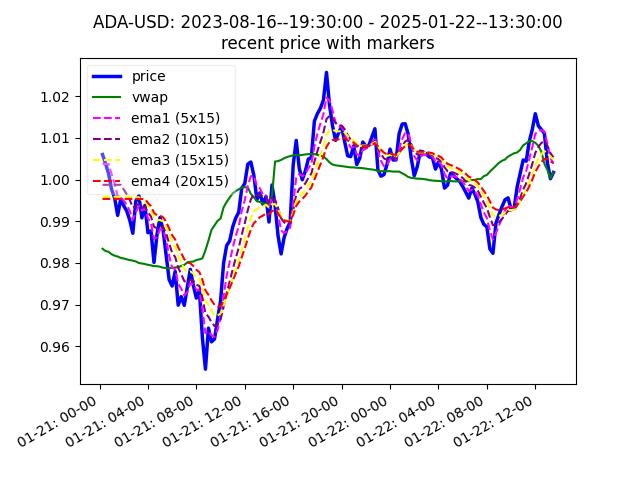
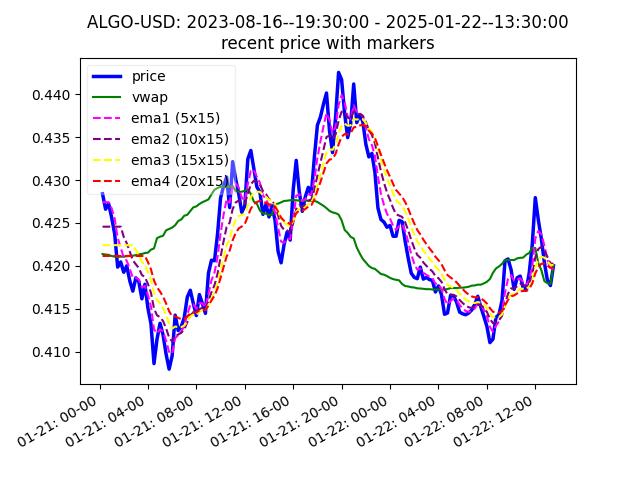
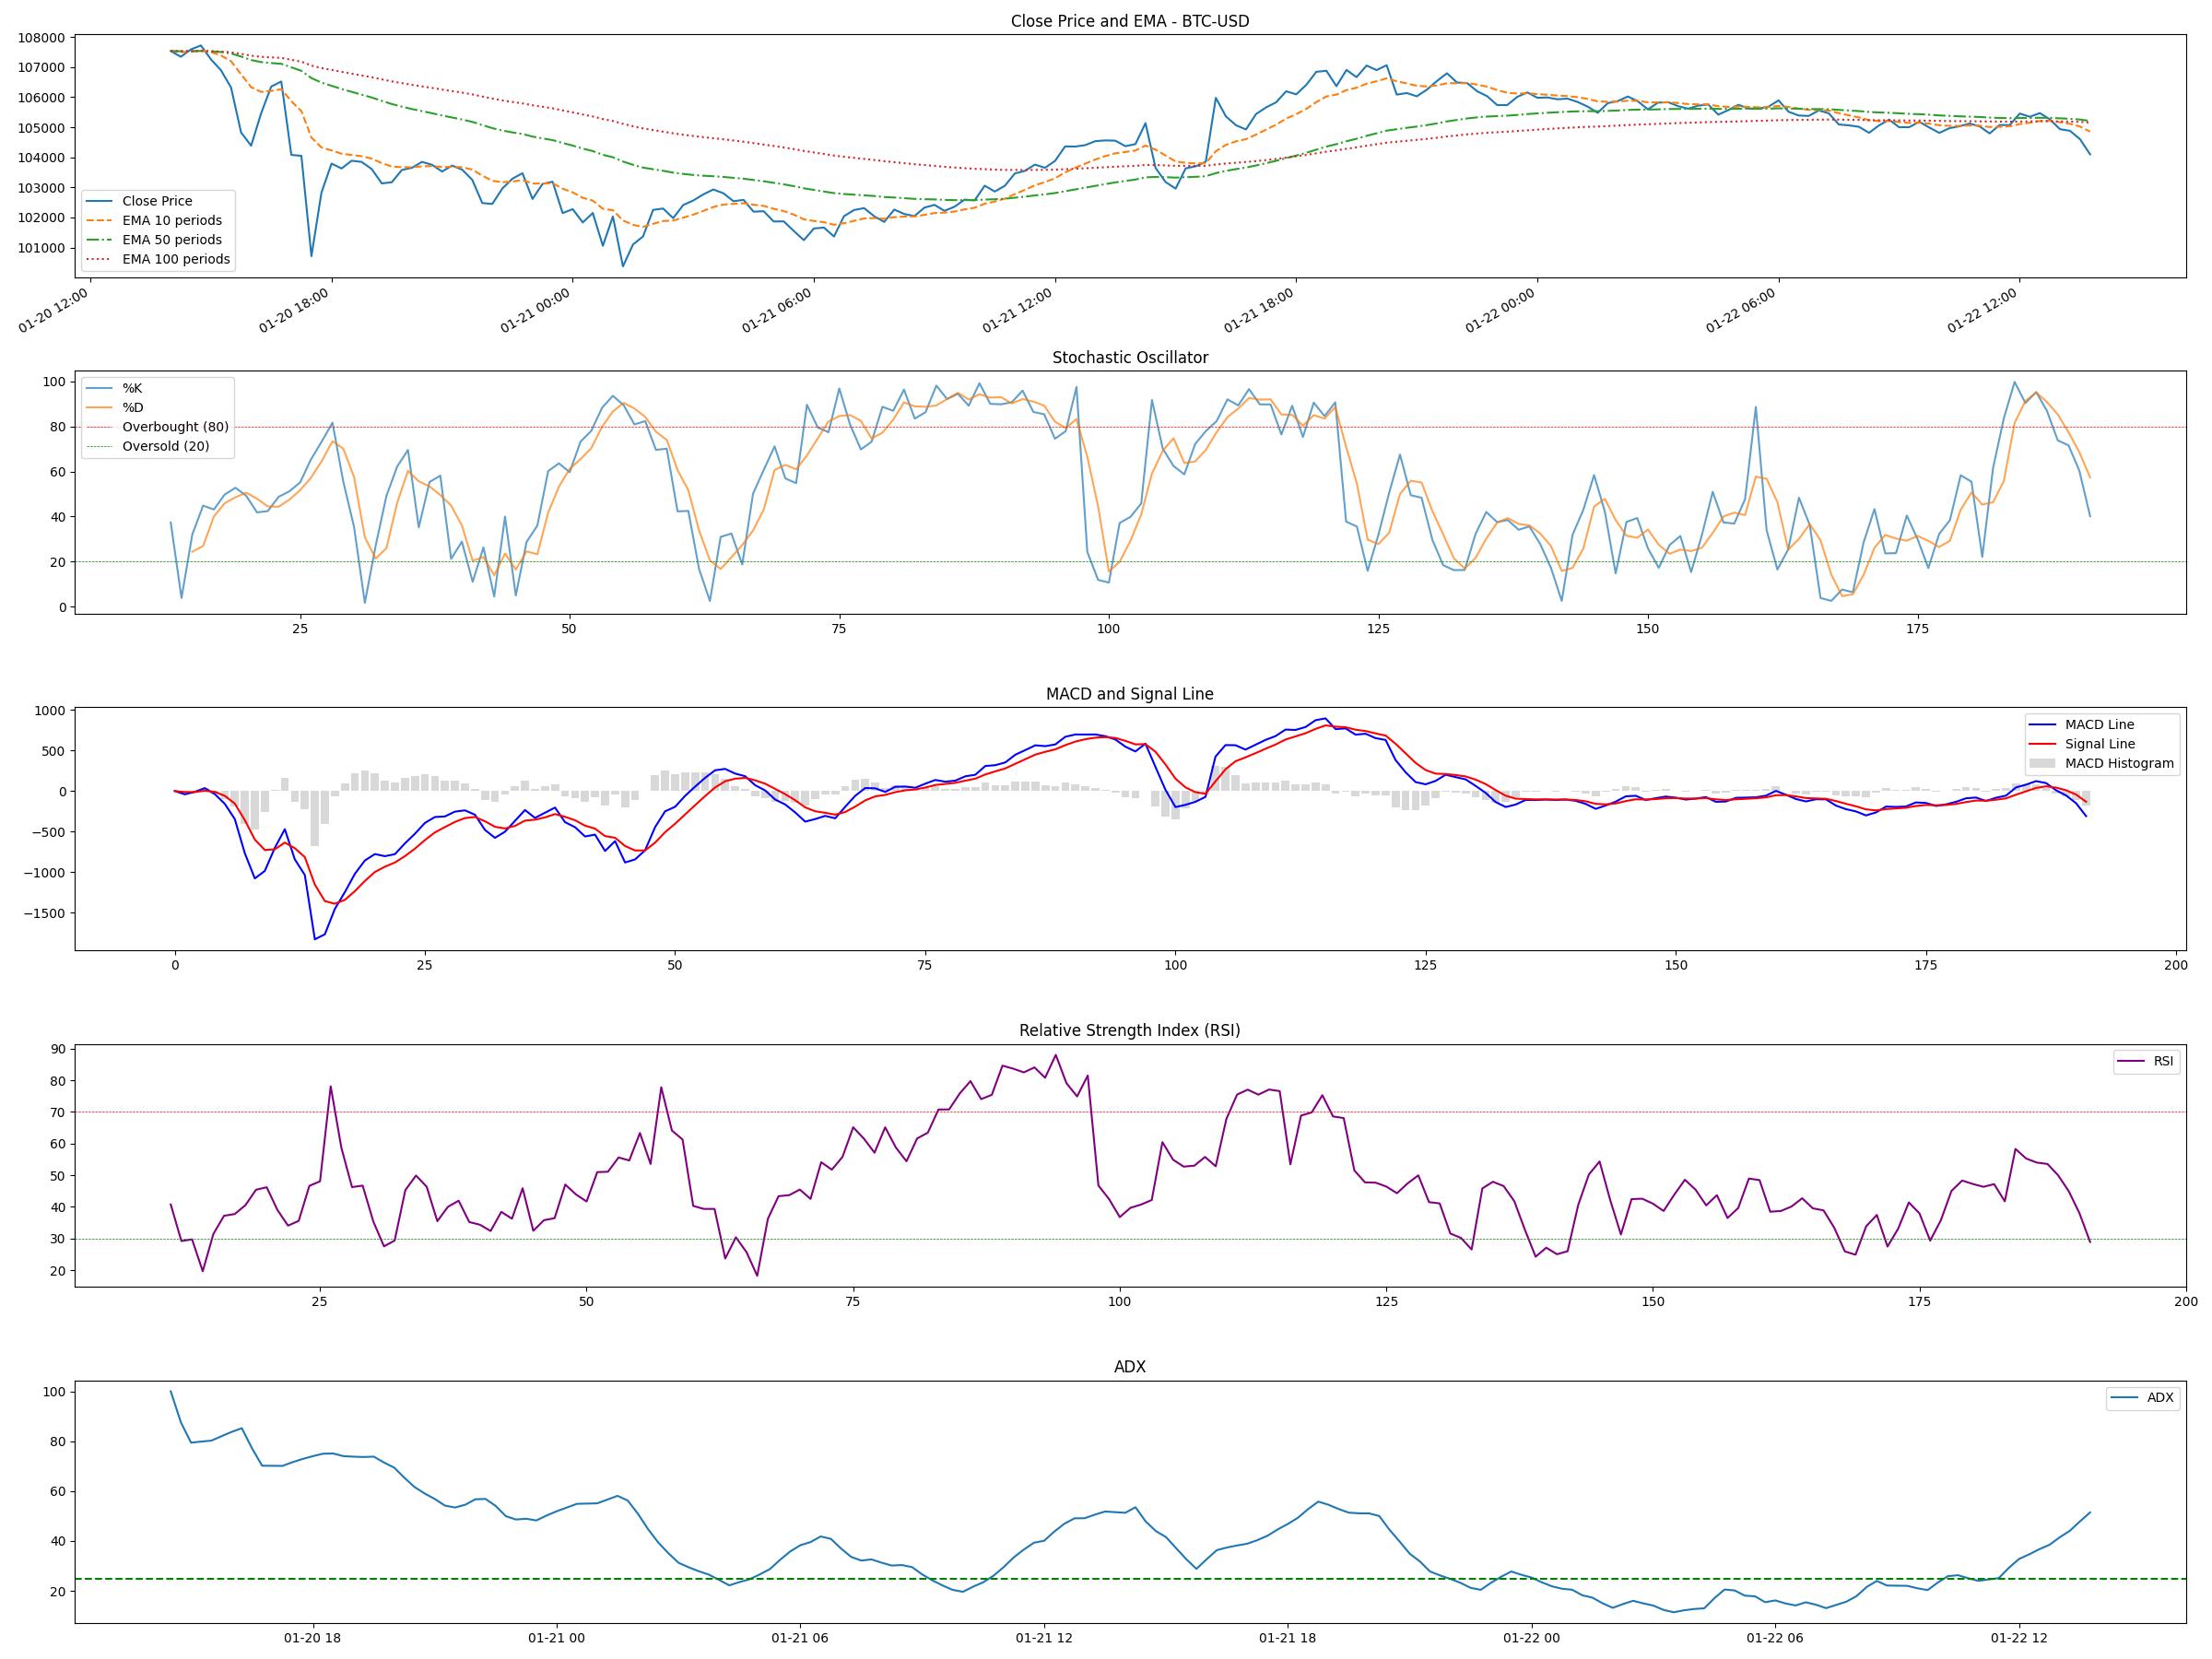
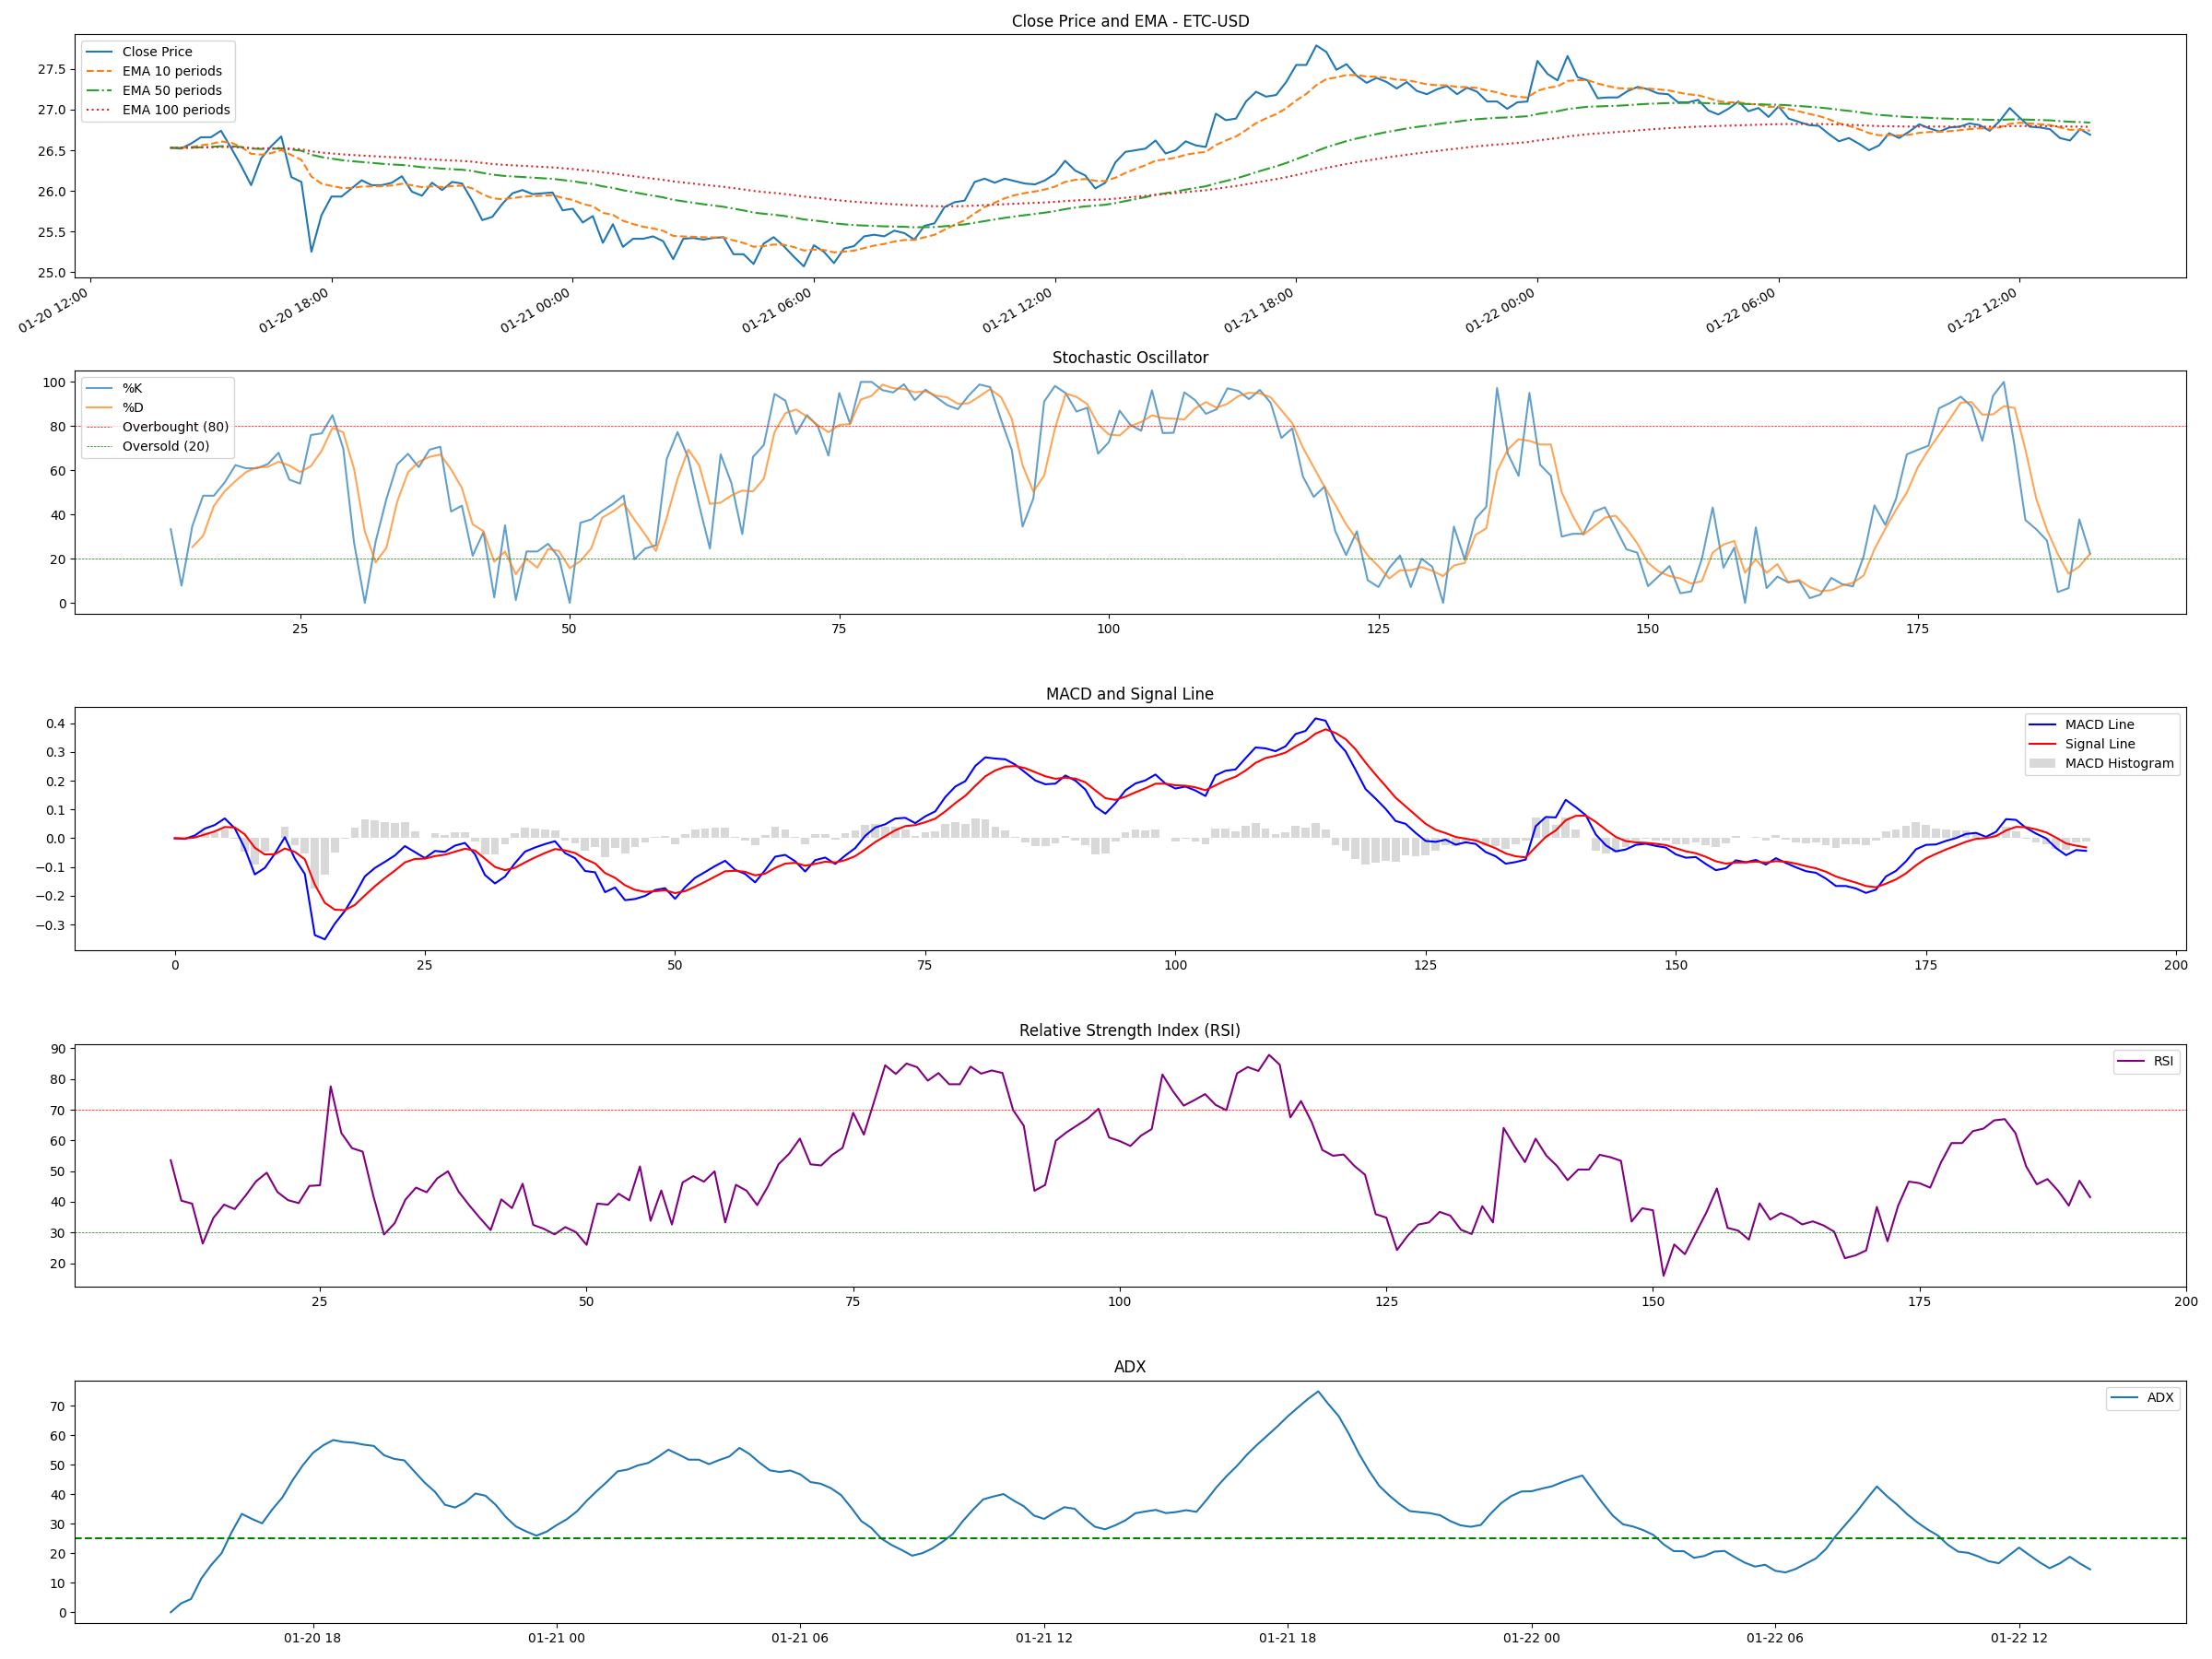
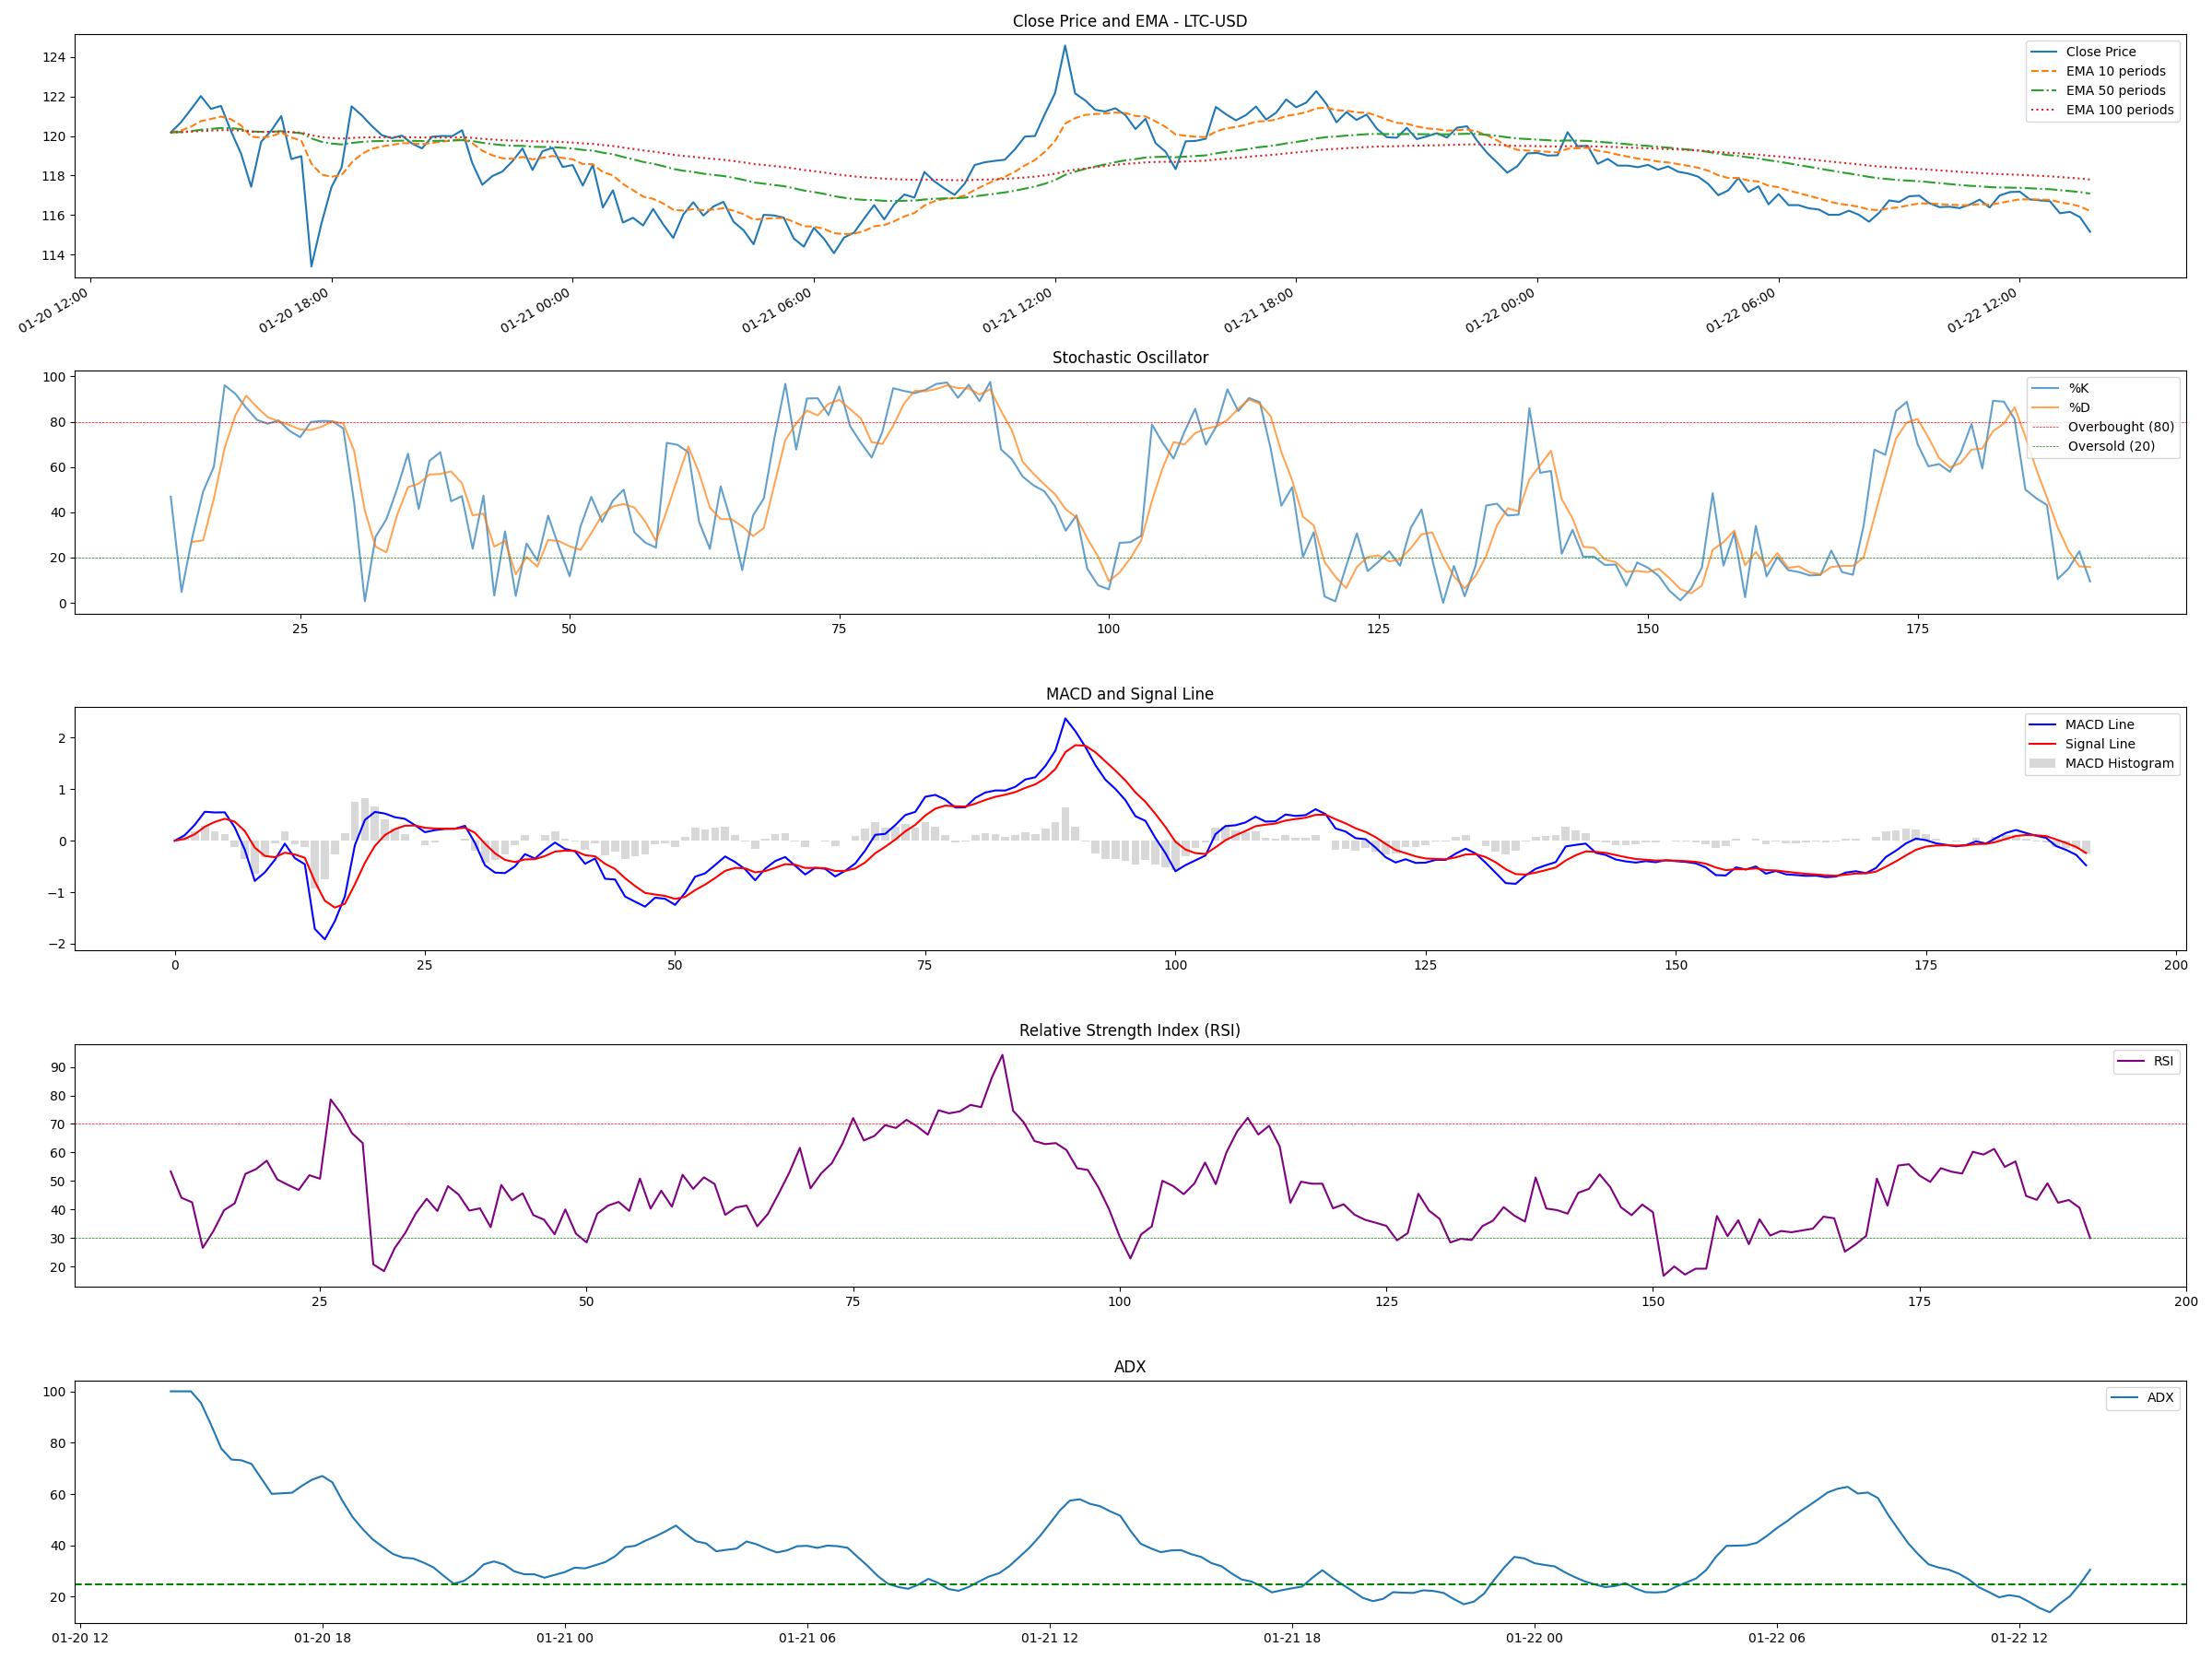
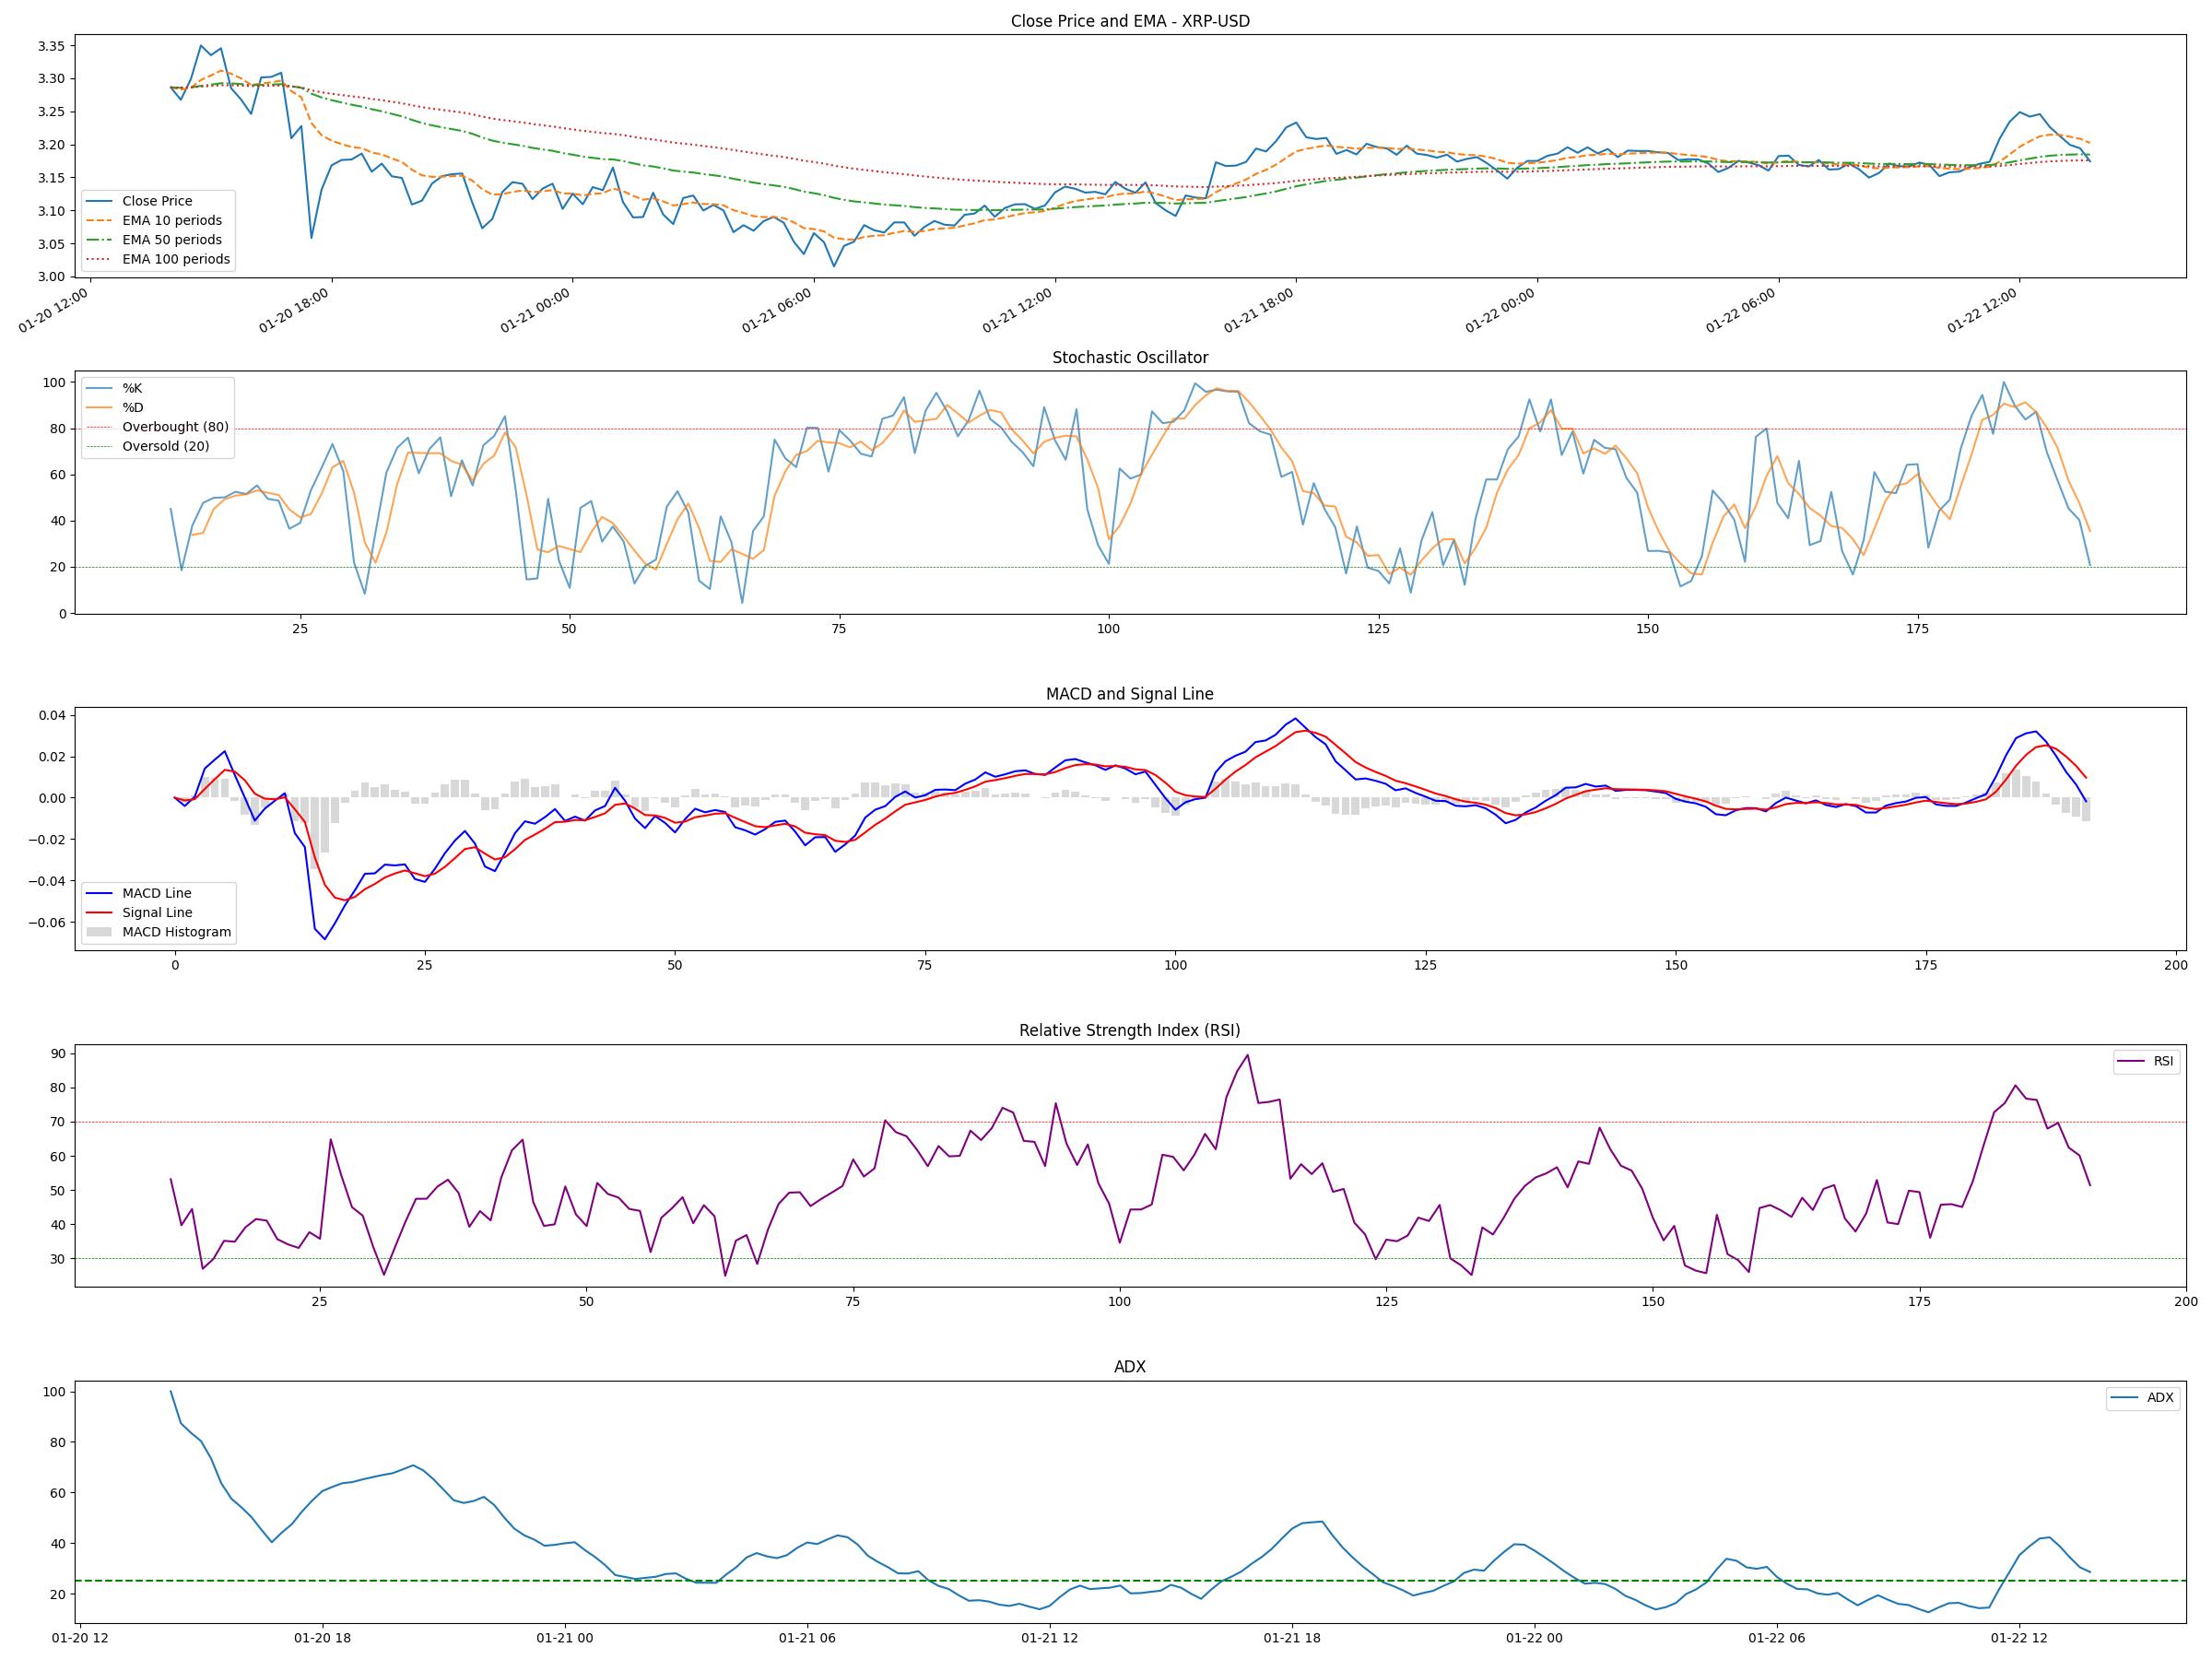
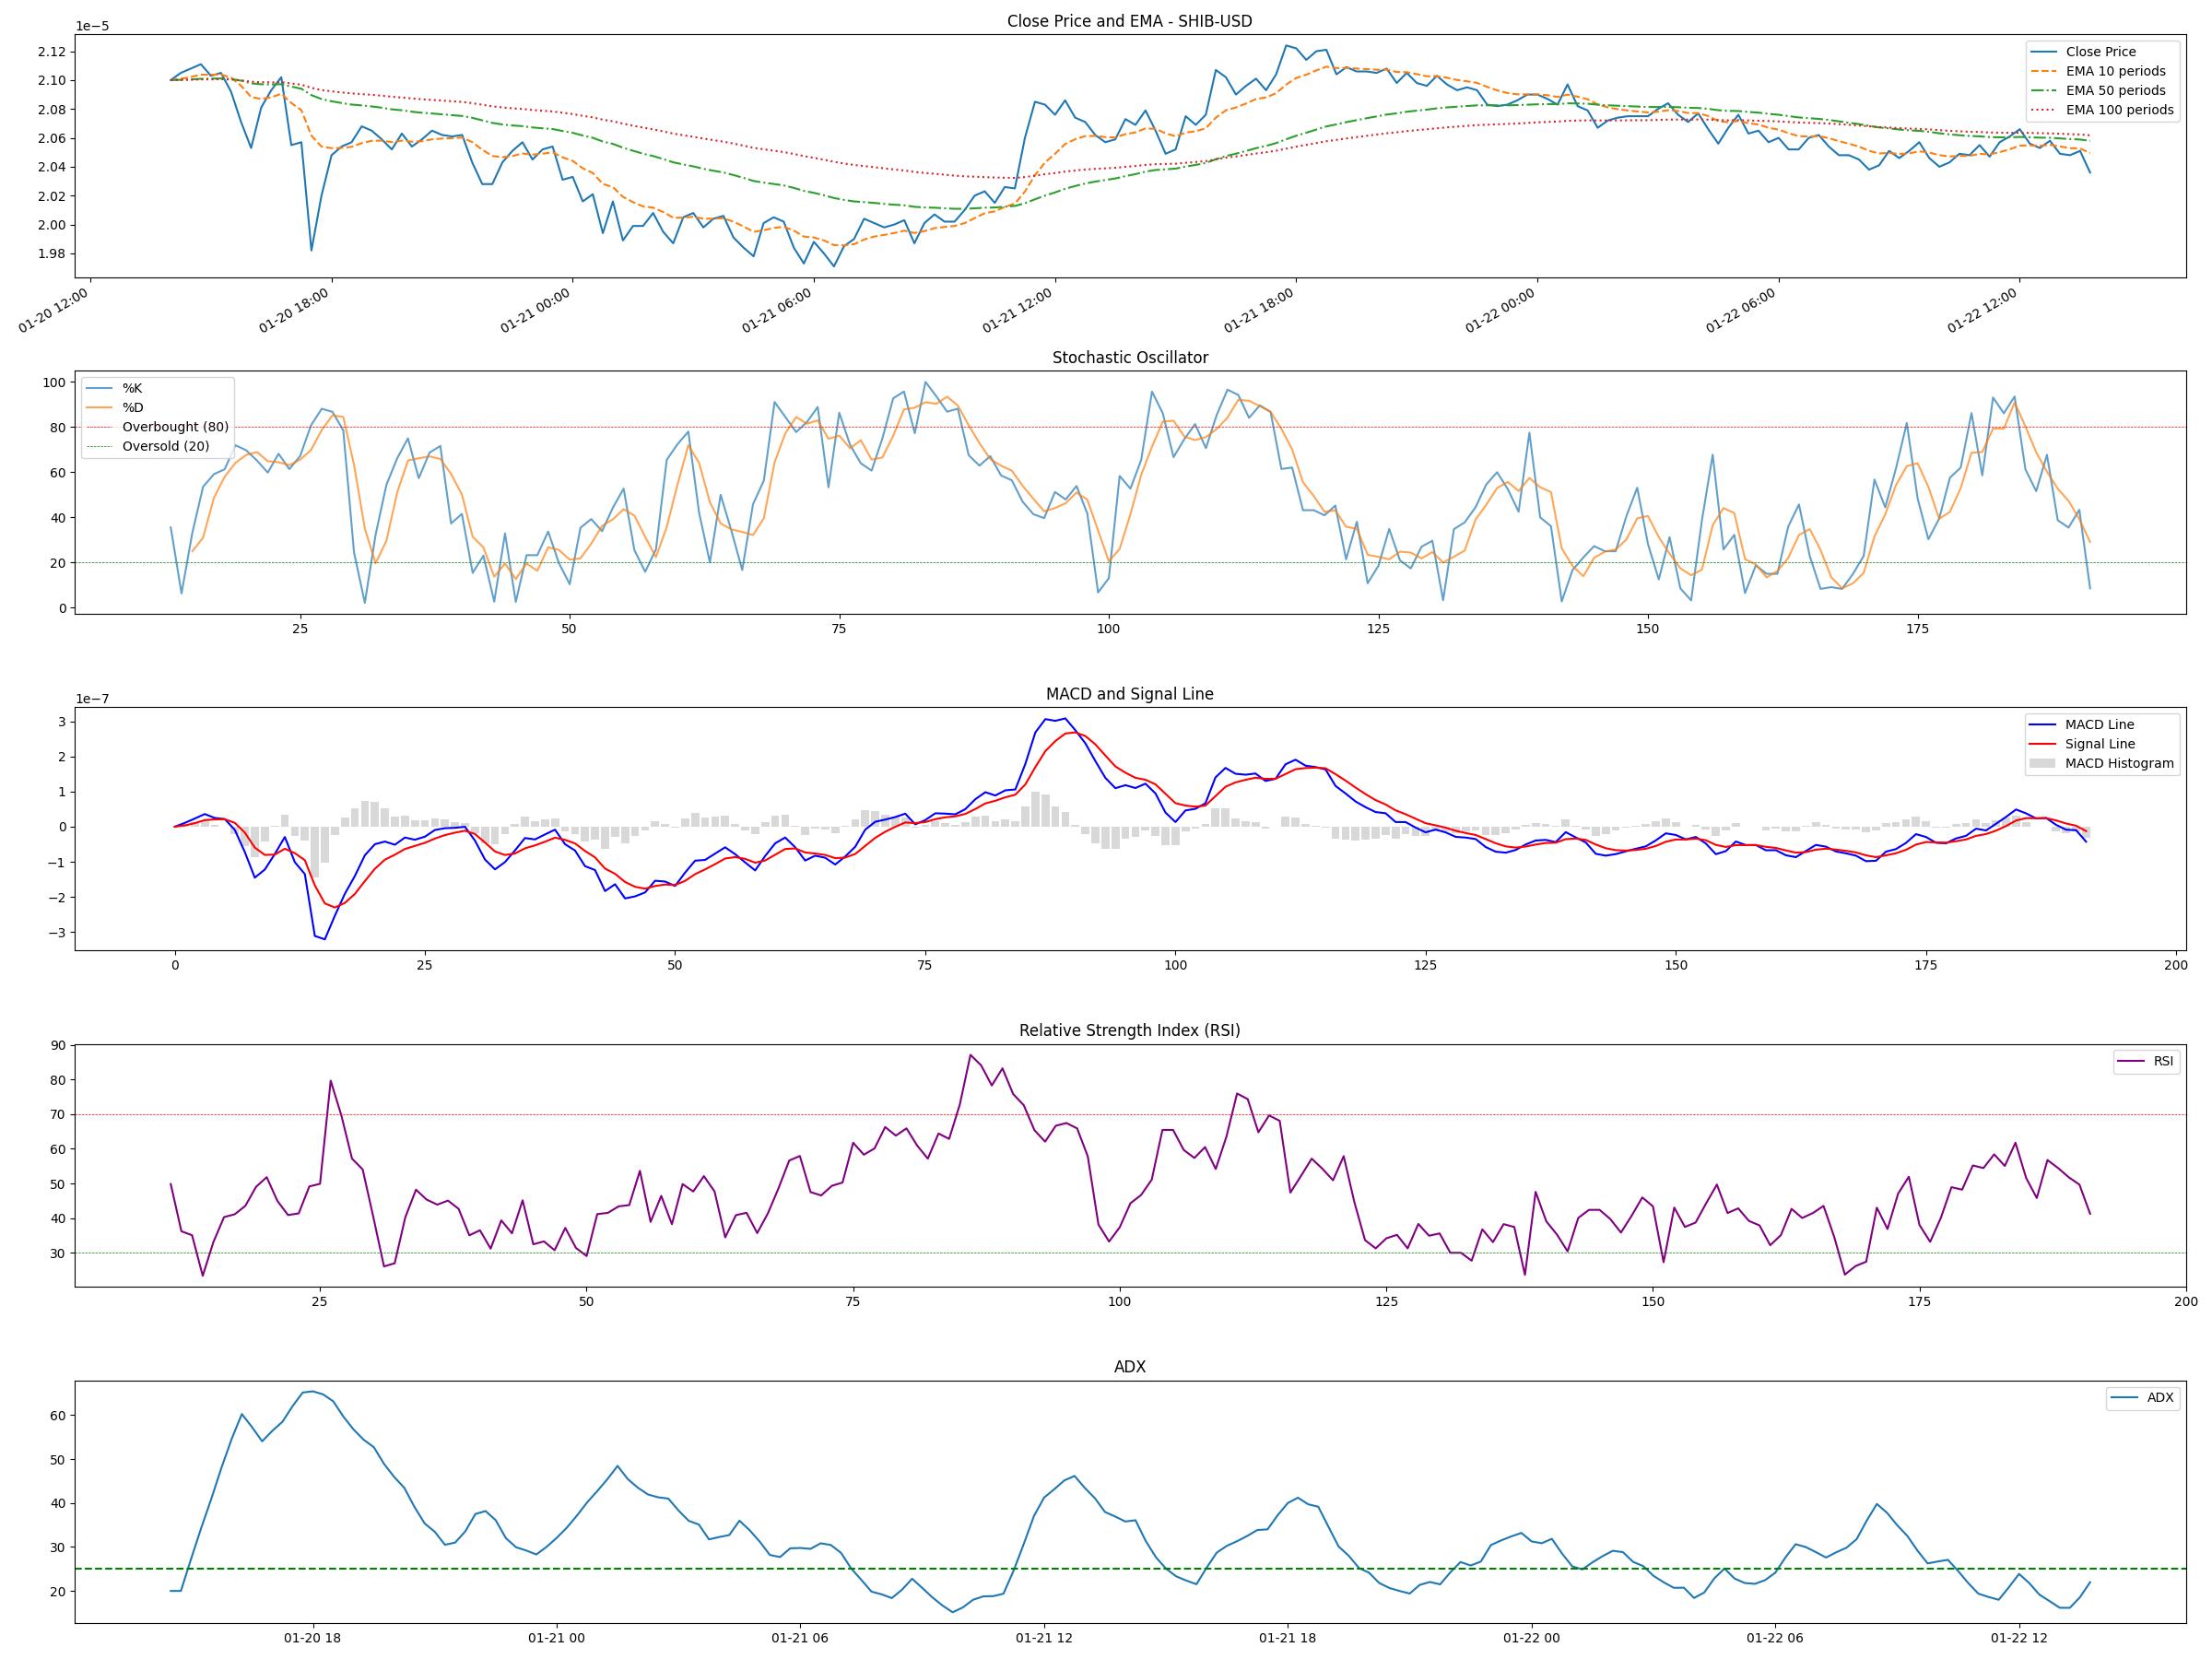
Recent indicator analysis and price action.
Notes
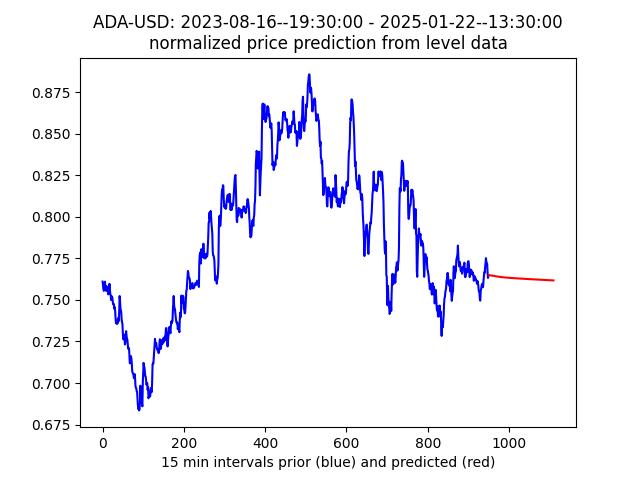
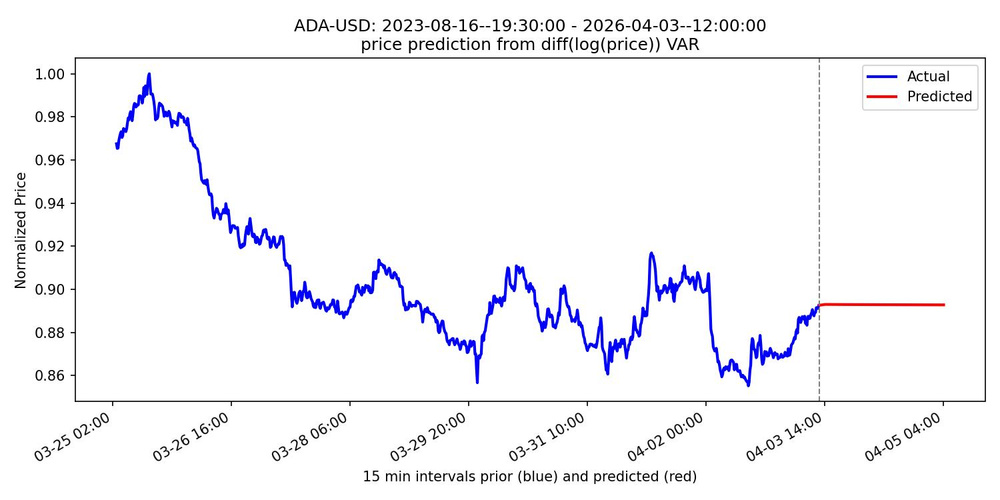
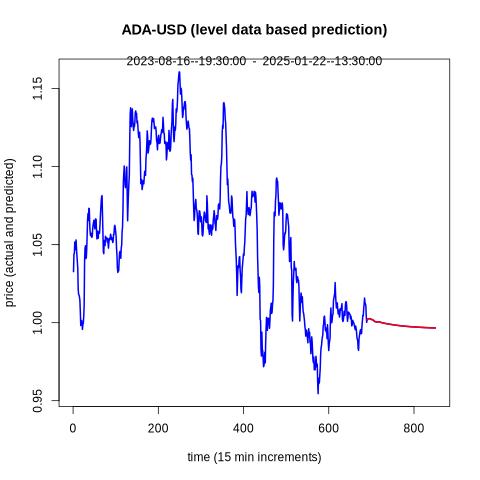
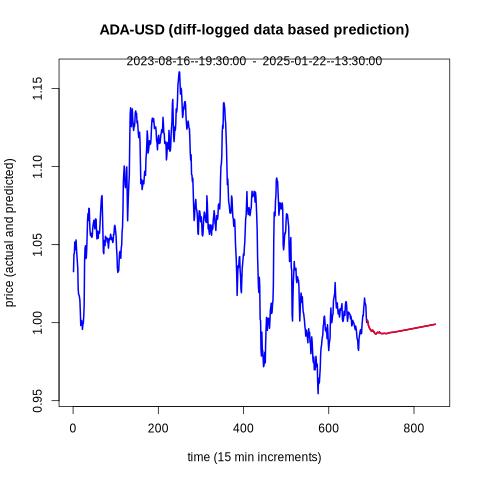
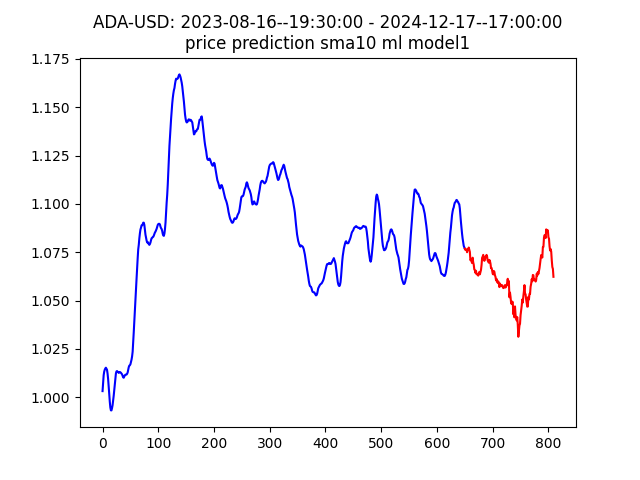
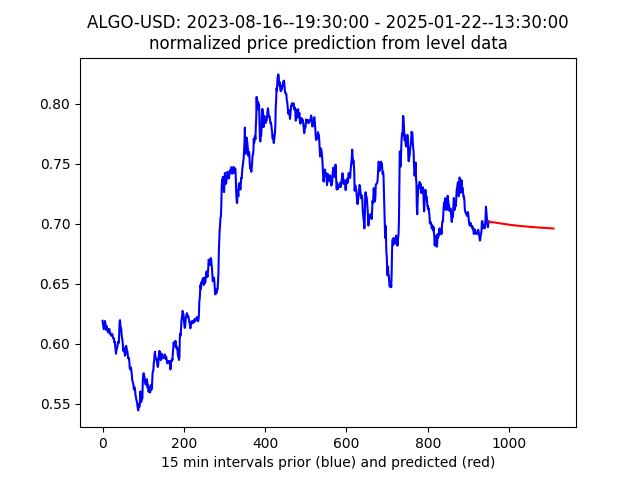
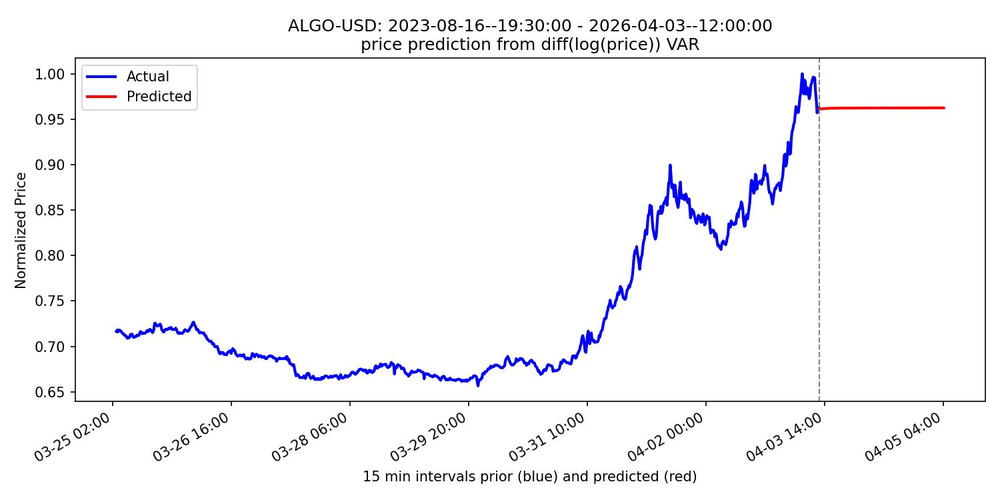
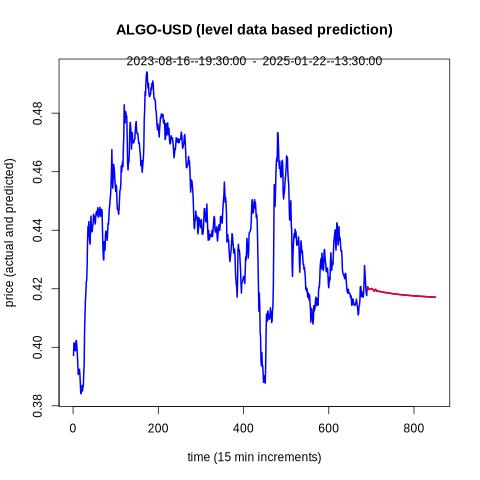
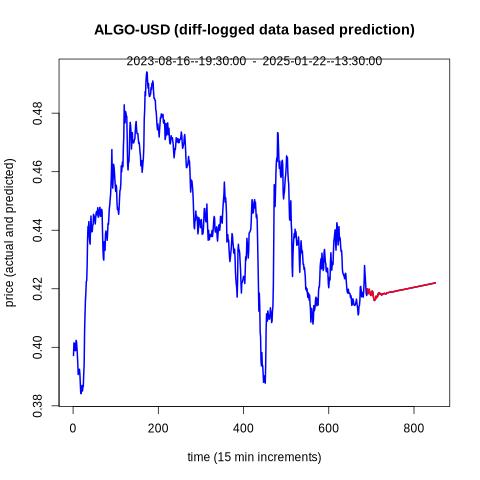
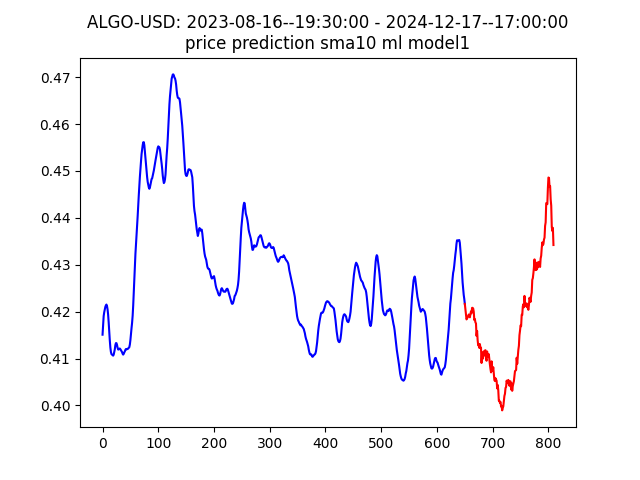
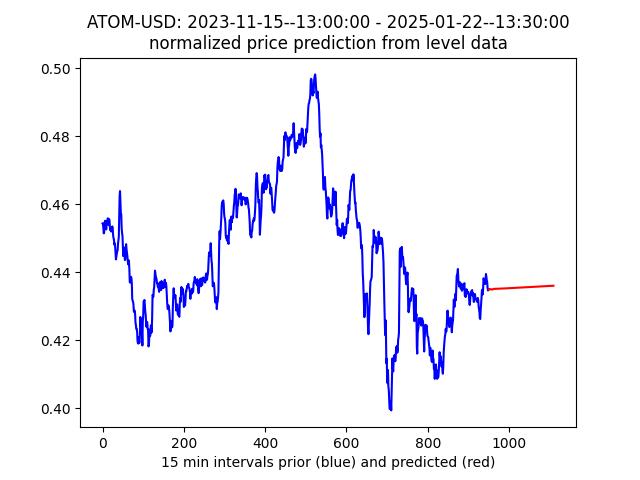
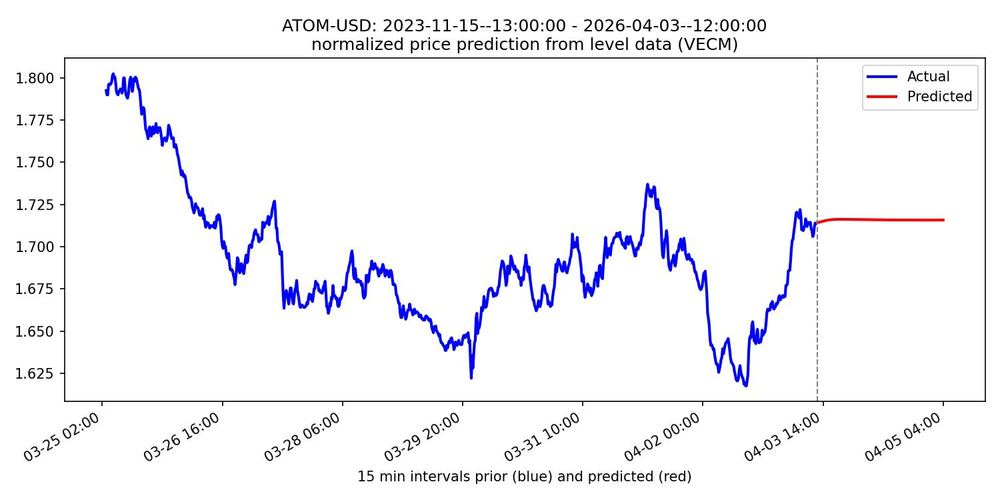
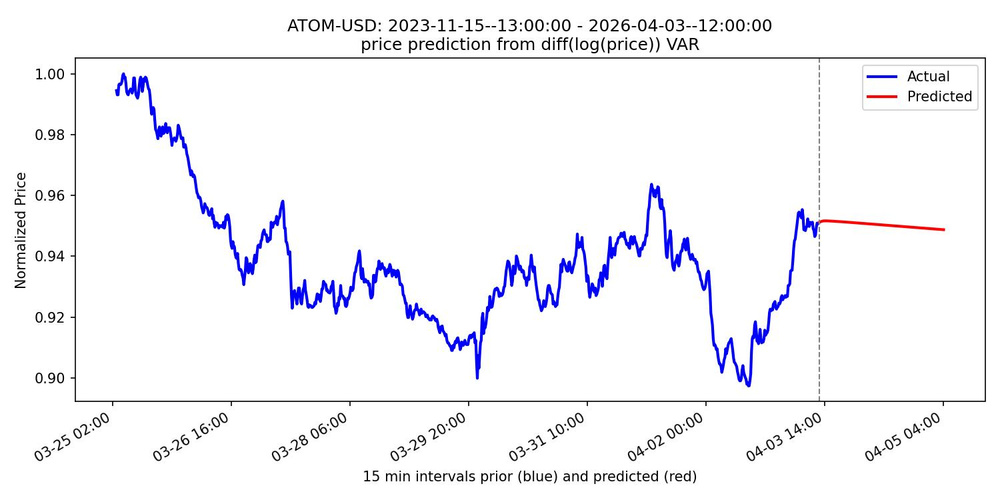
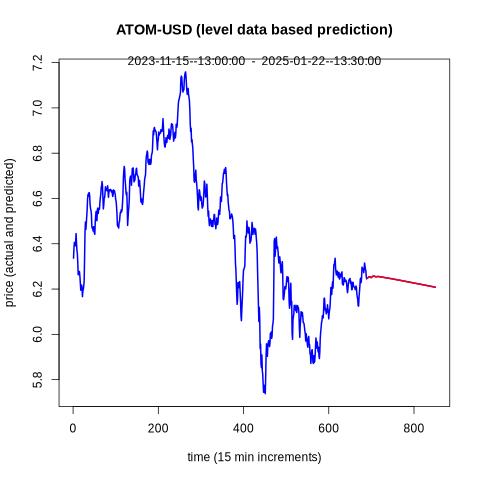
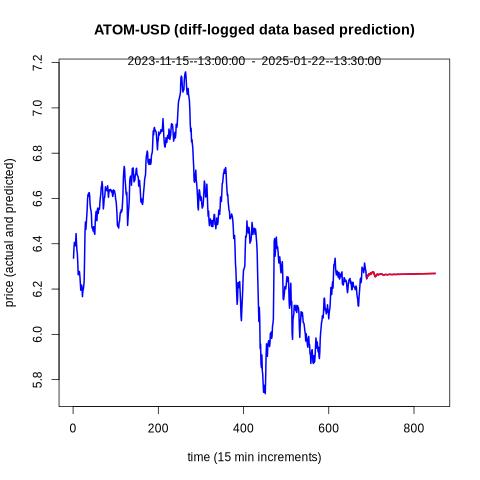
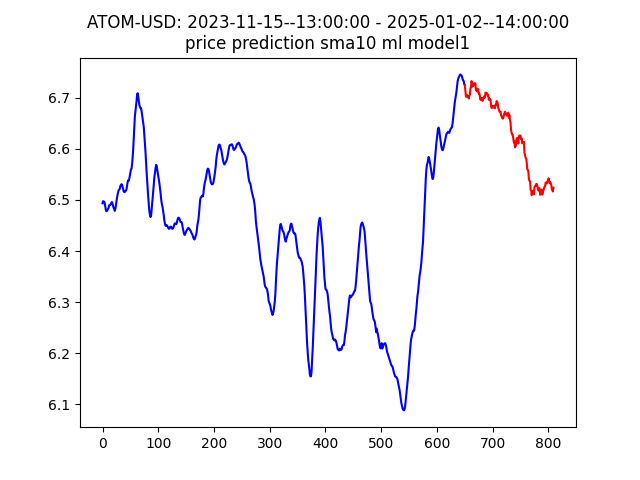
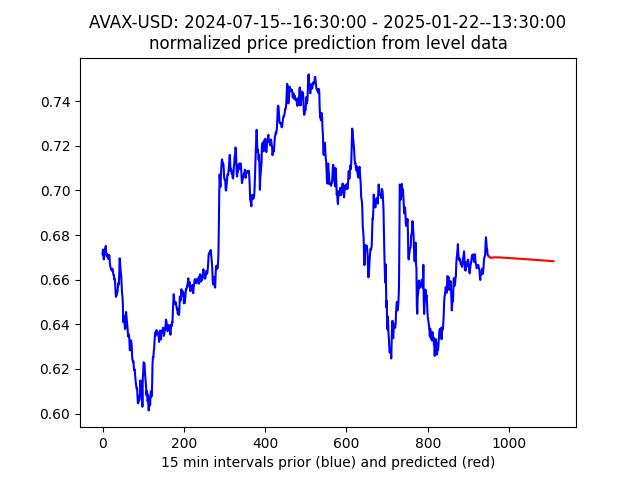
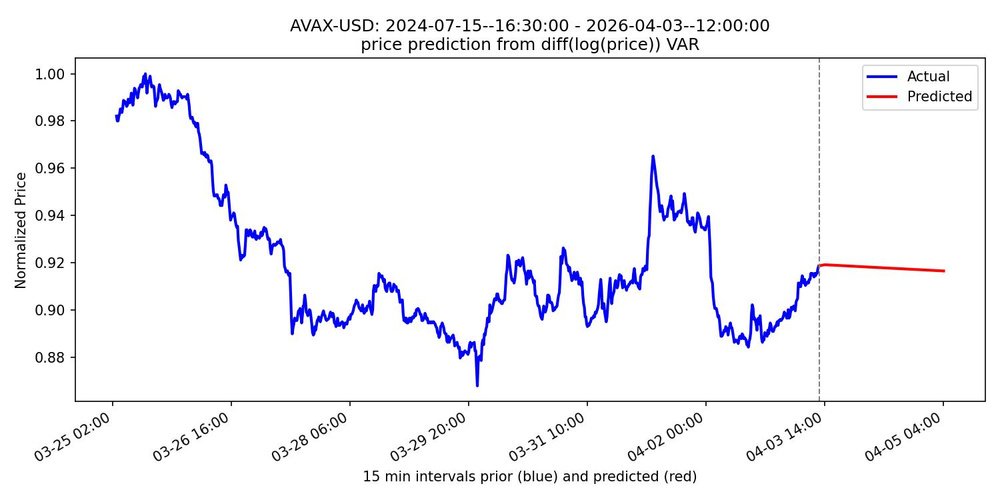
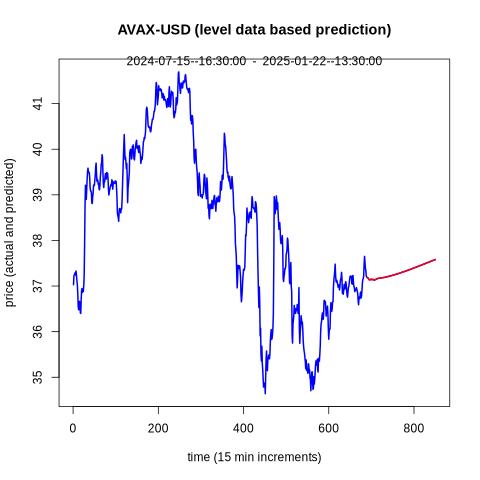
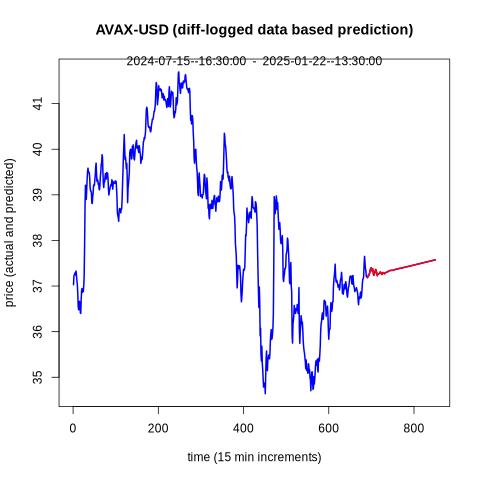
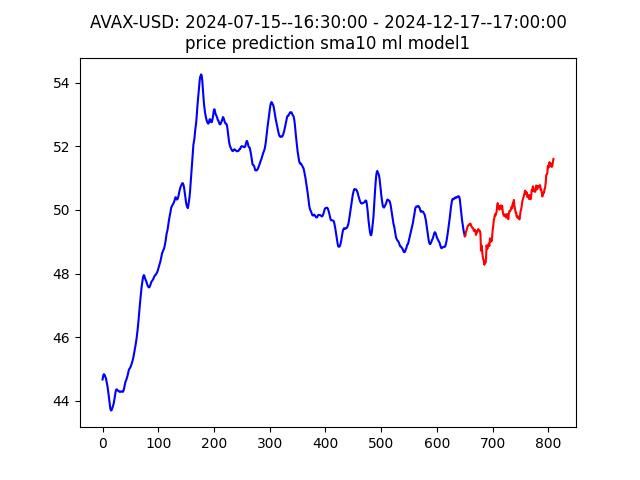
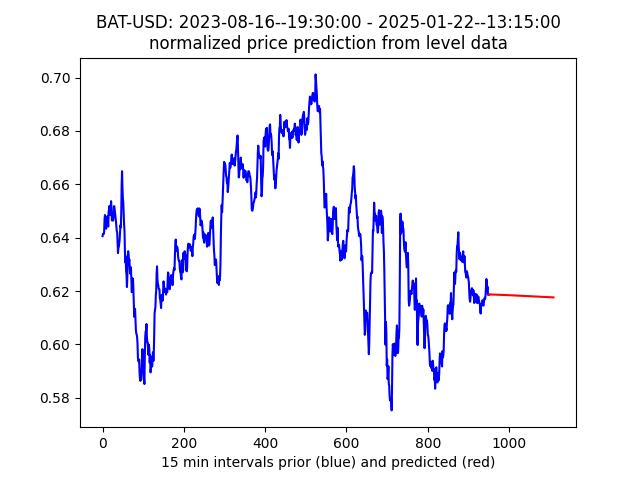
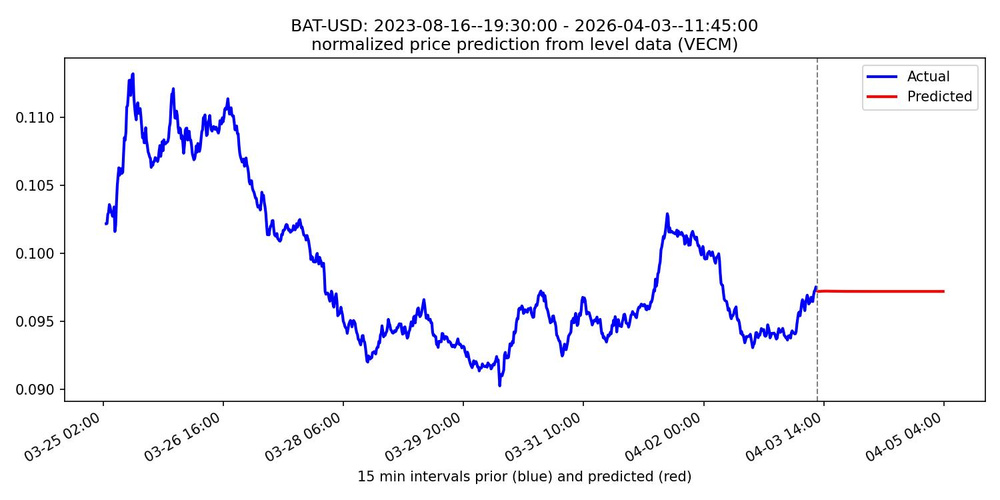
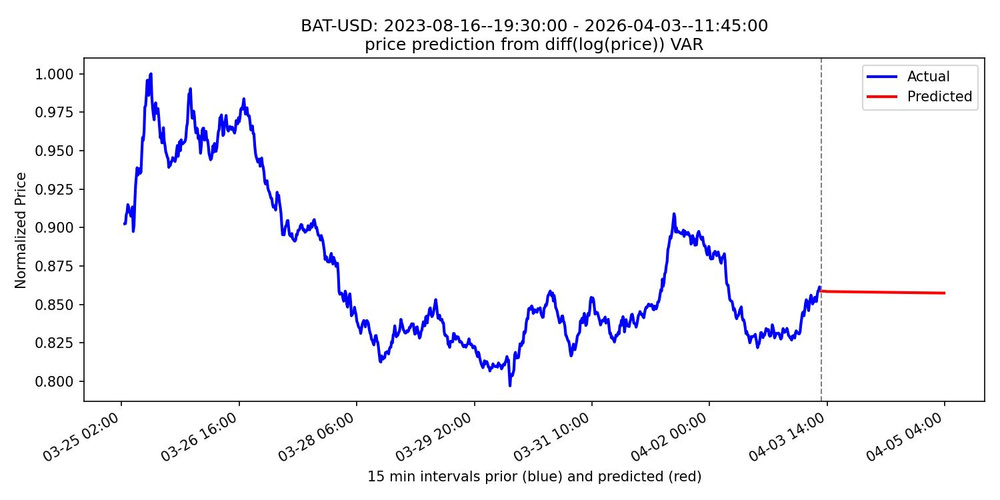
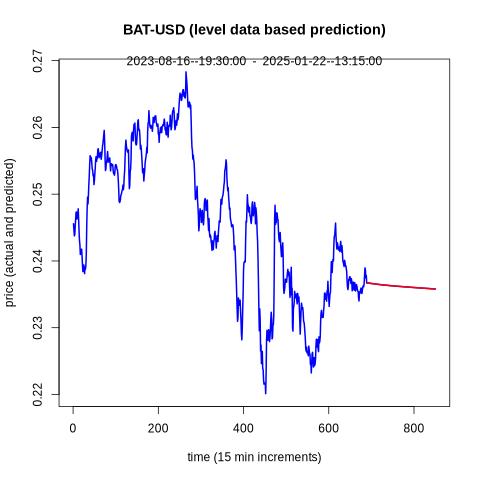
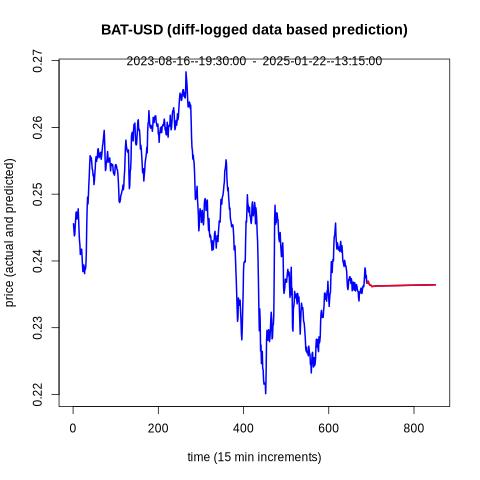
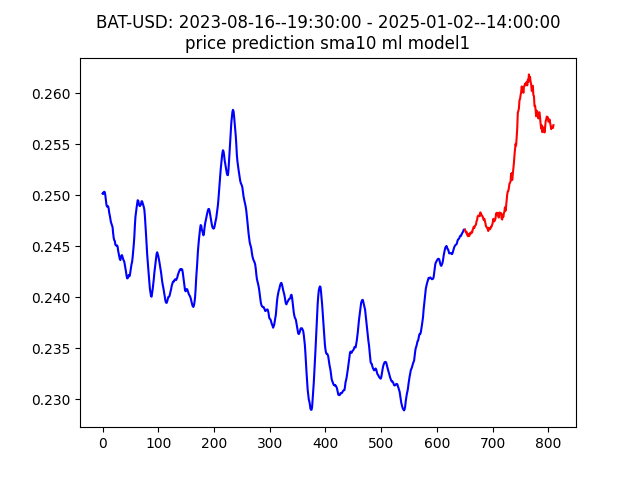
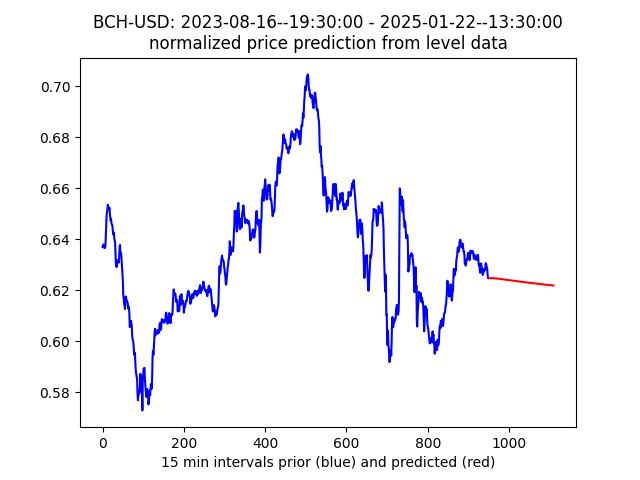
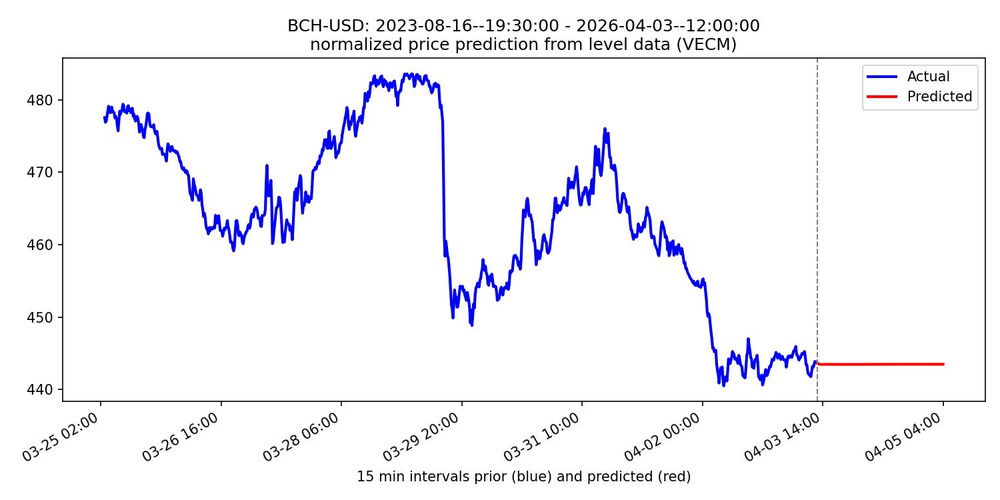
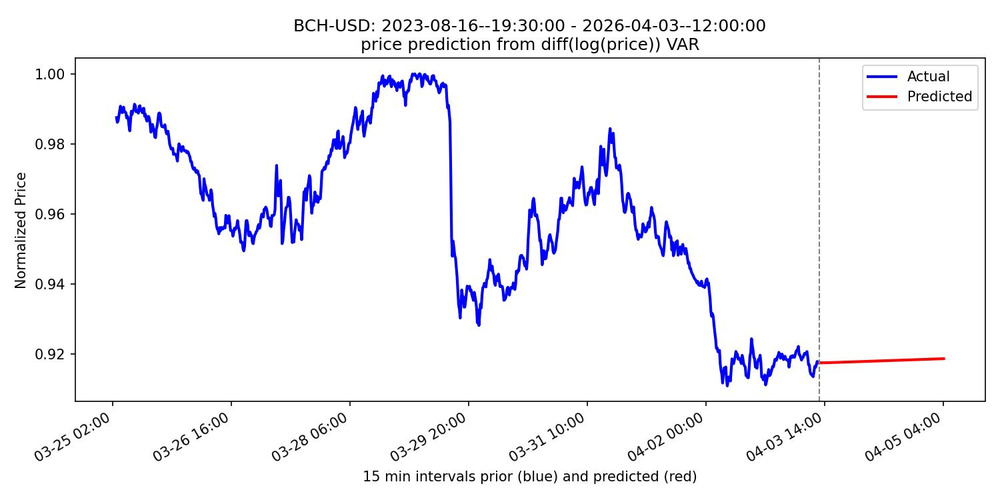
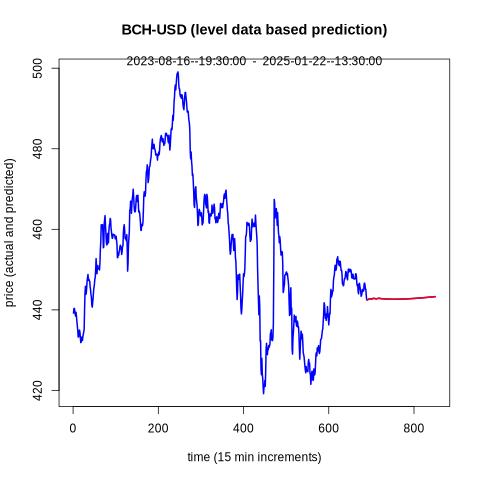
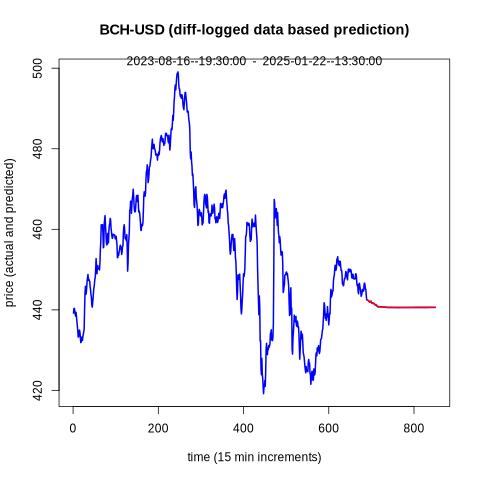
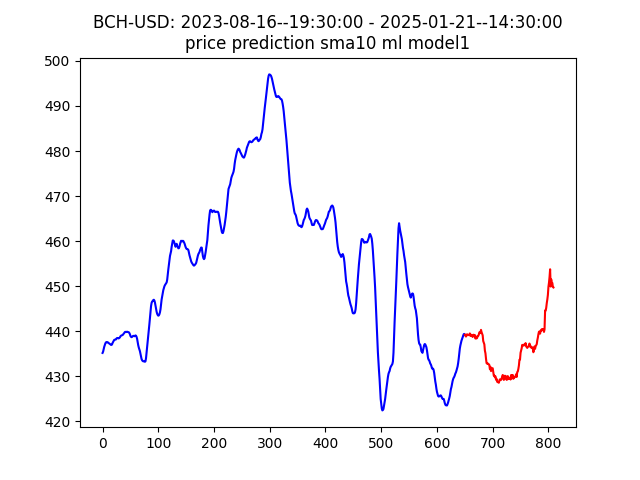
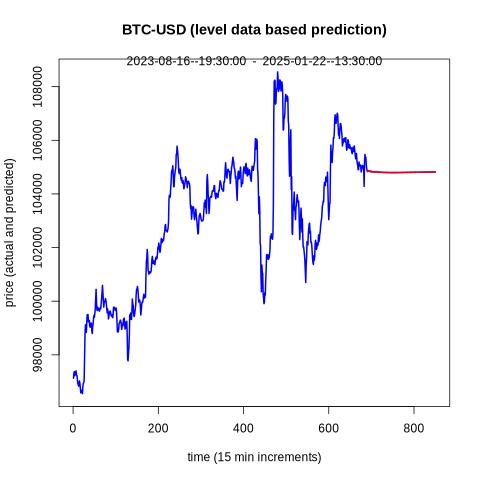
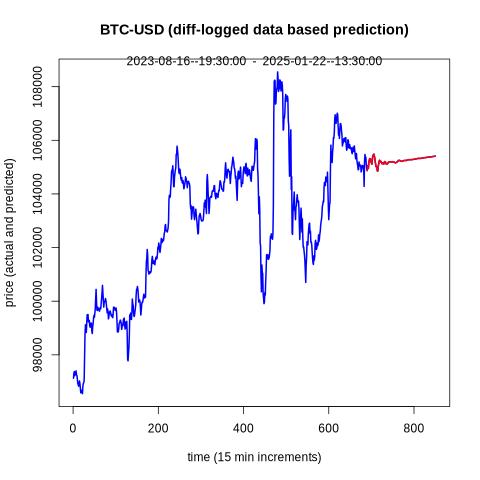
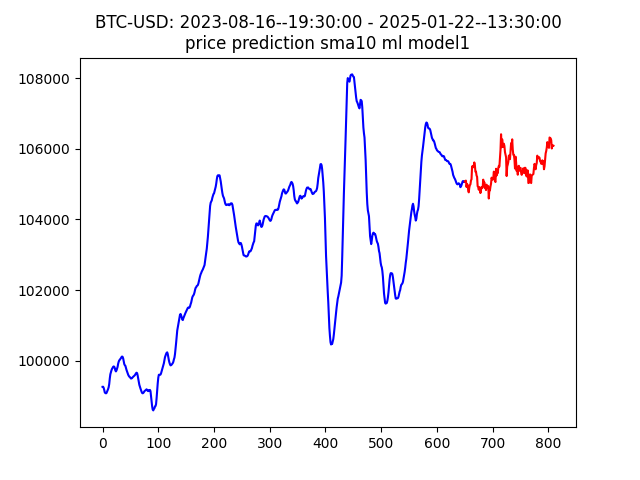
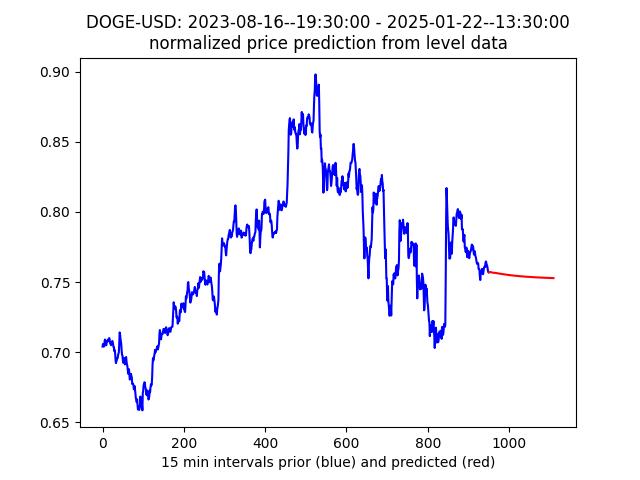
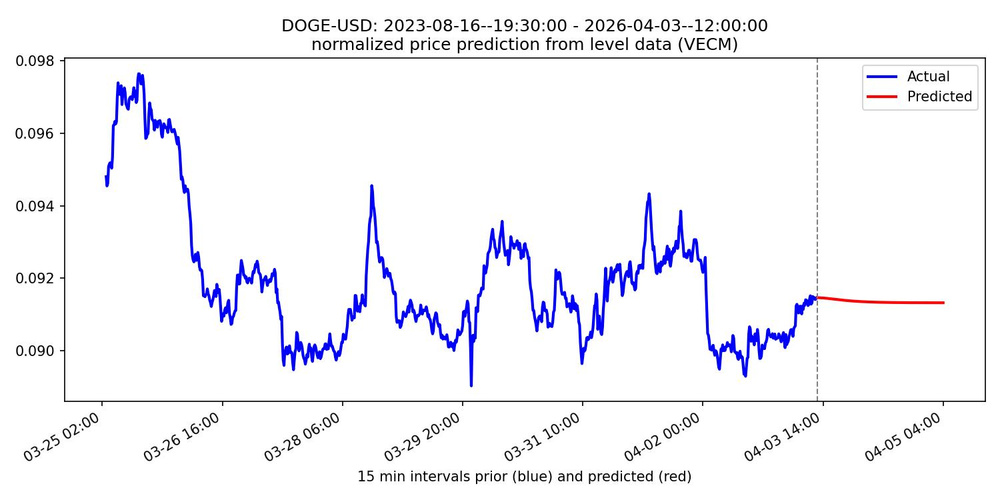
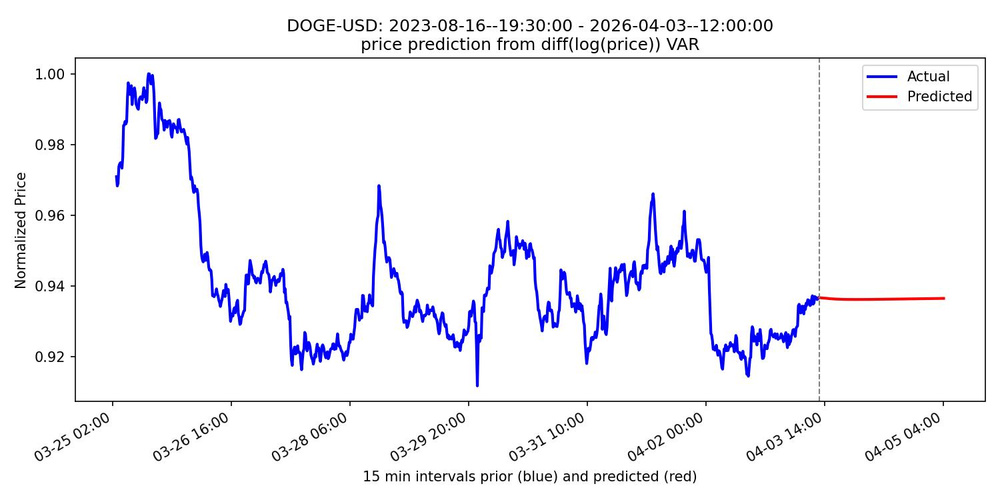
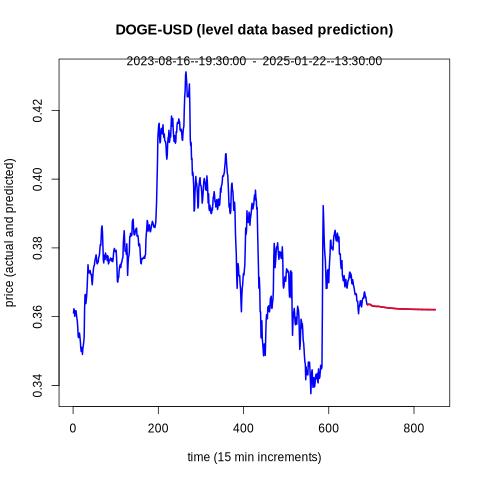
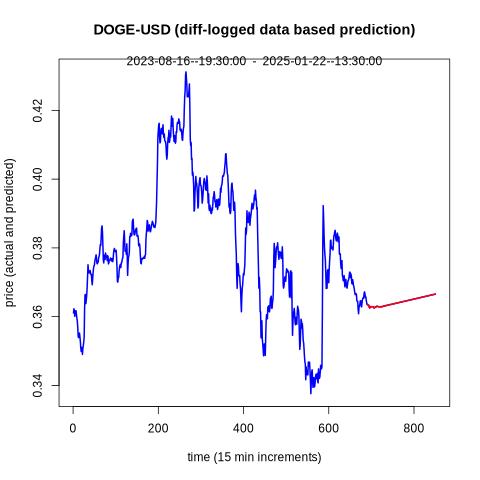
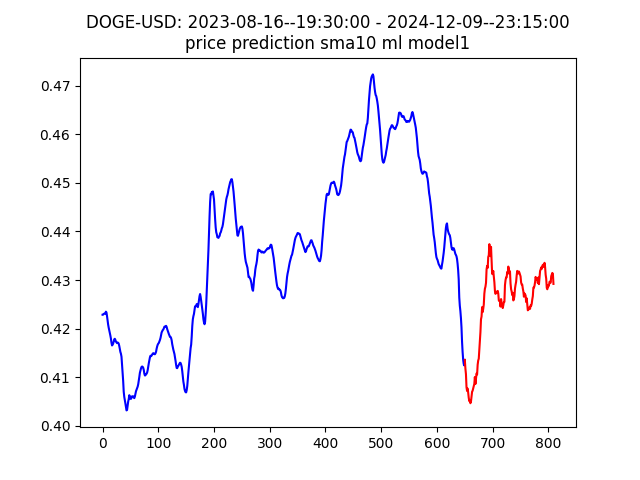
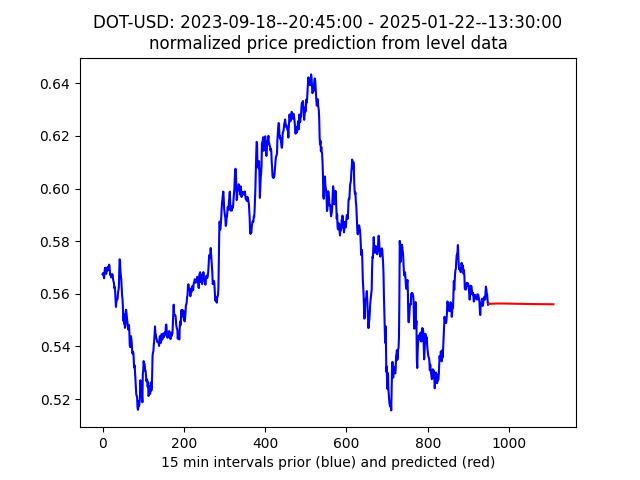
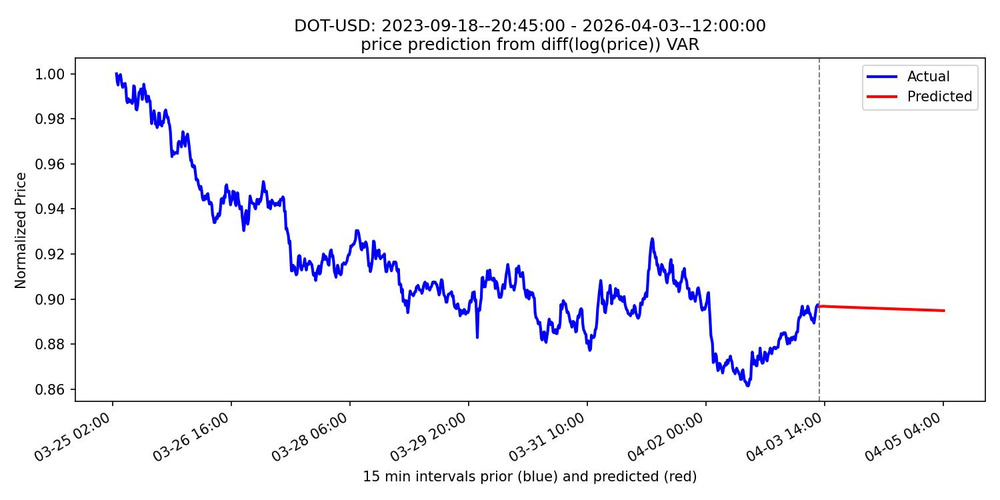
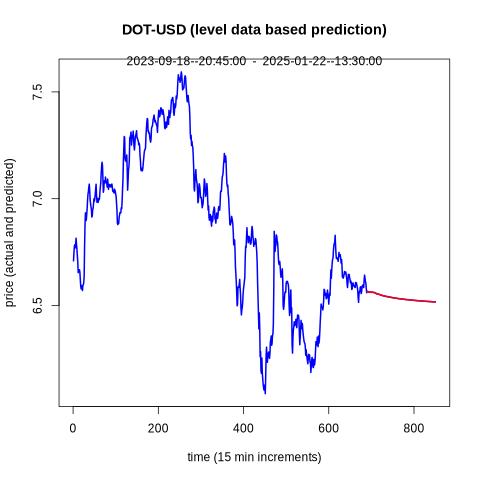
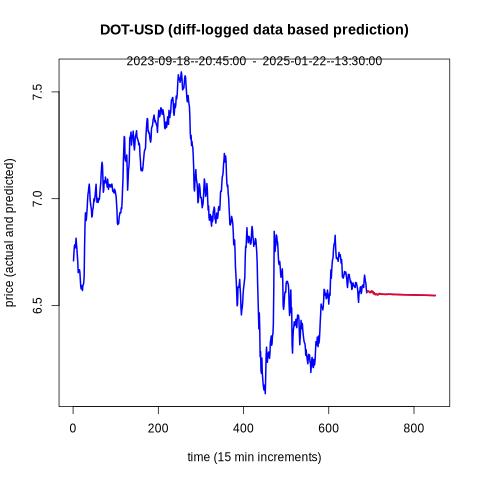
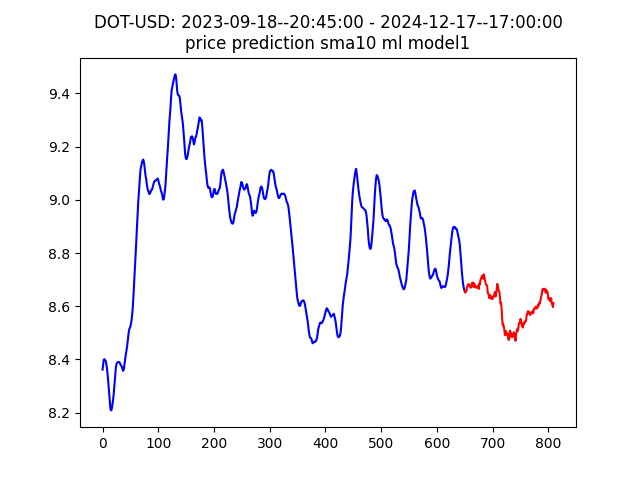
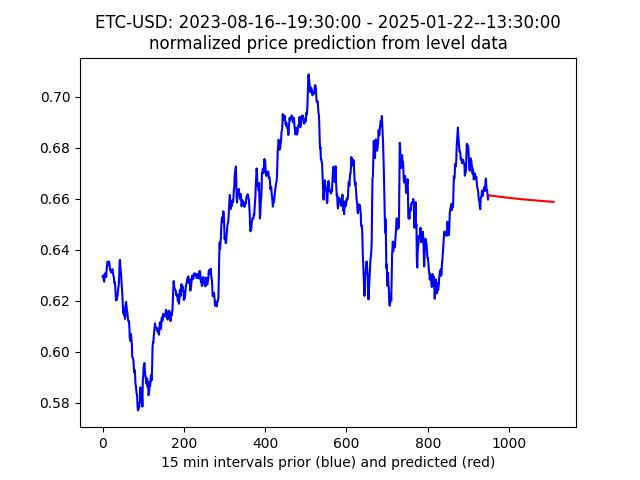
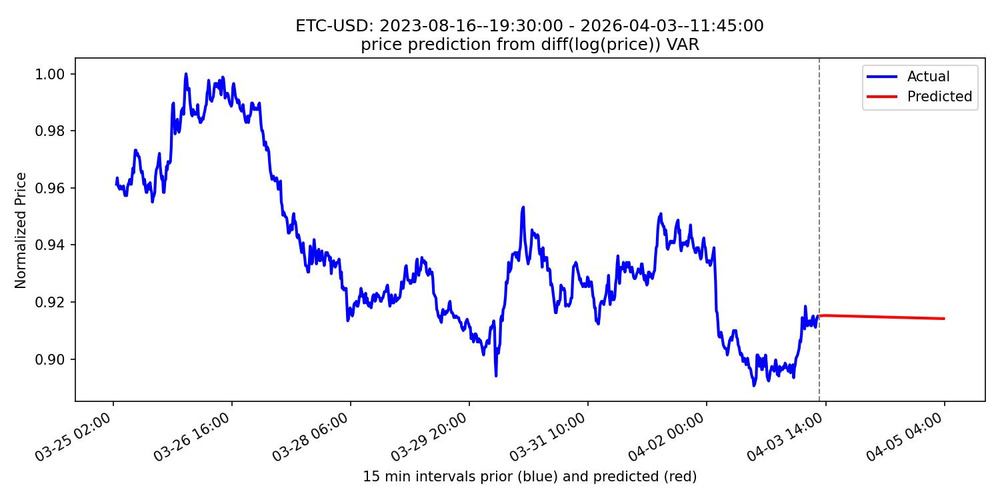
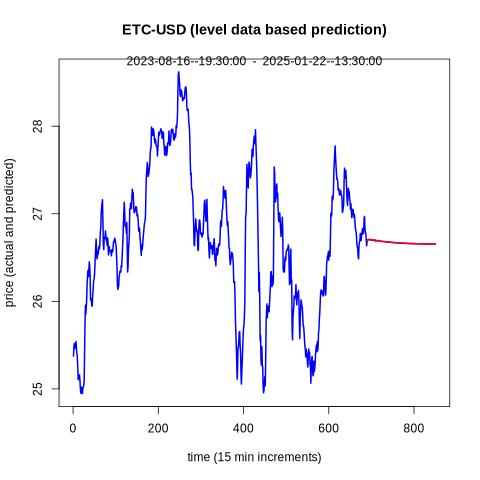
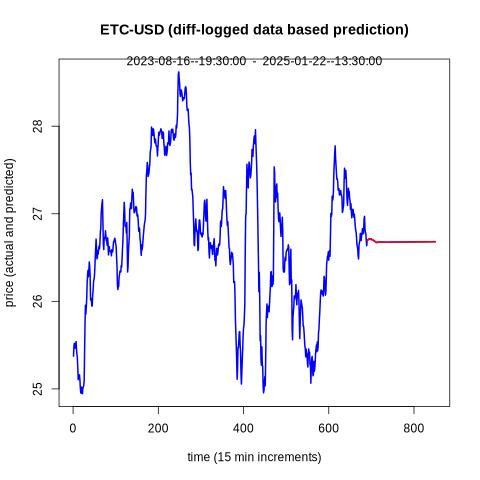
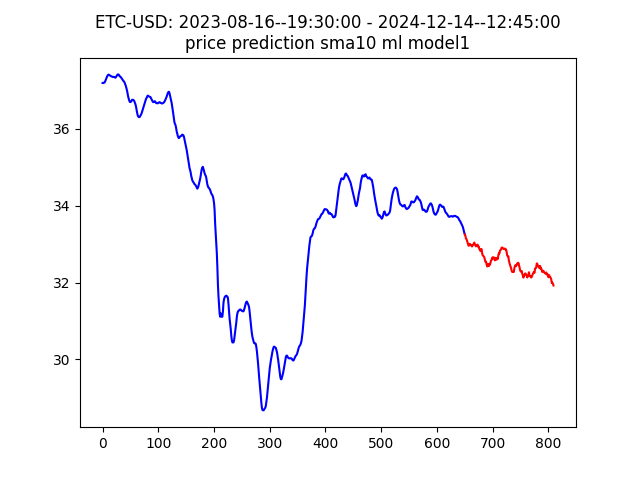
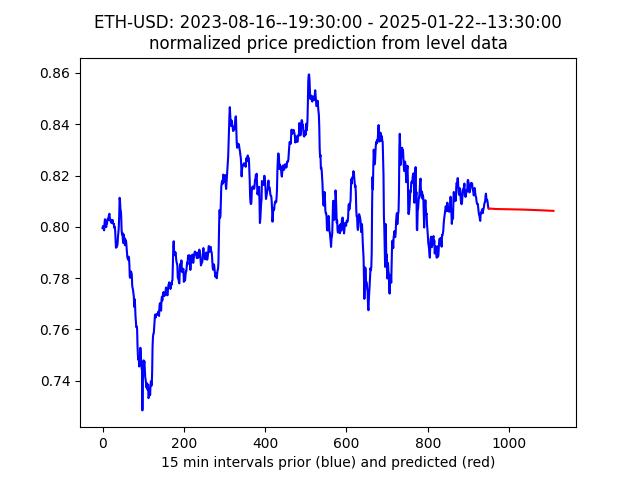
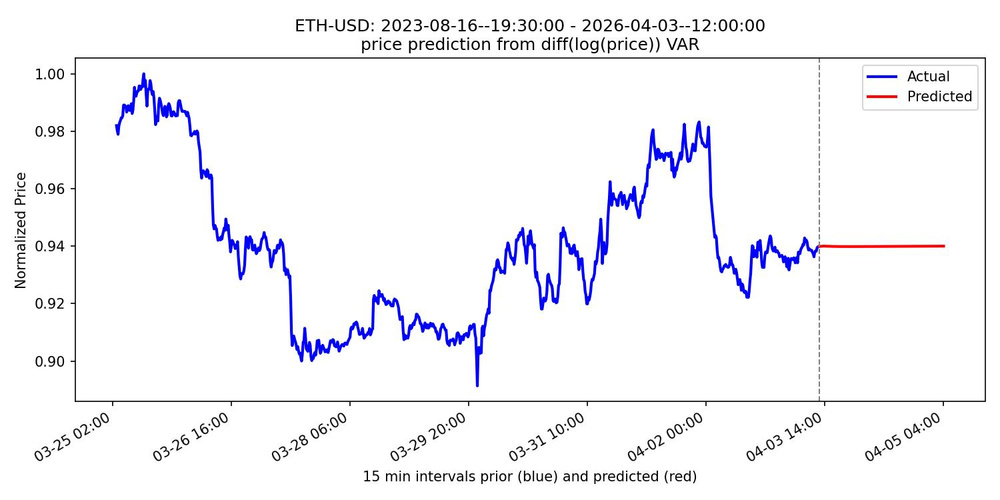
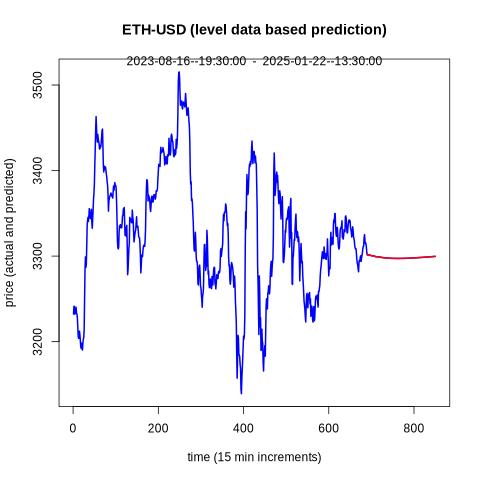
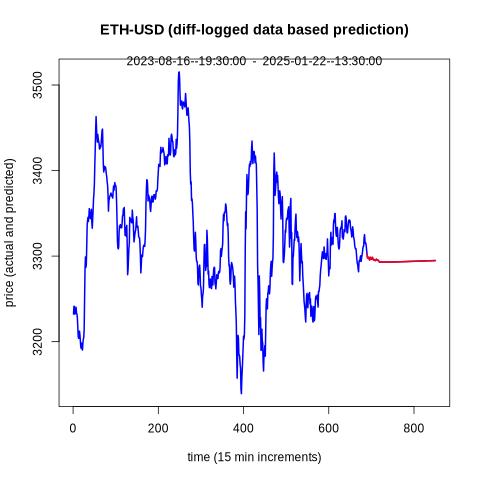
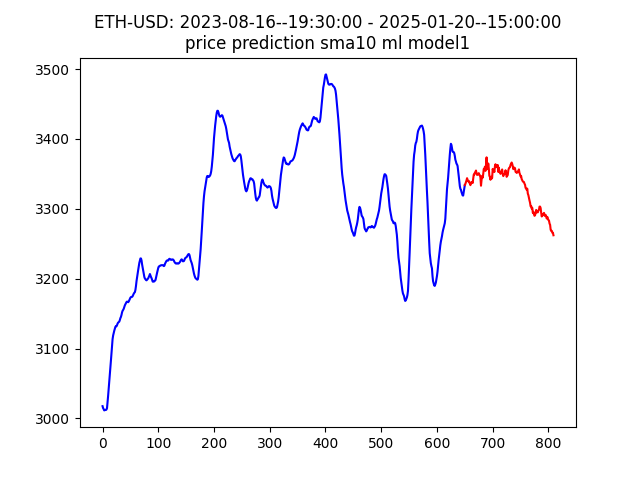
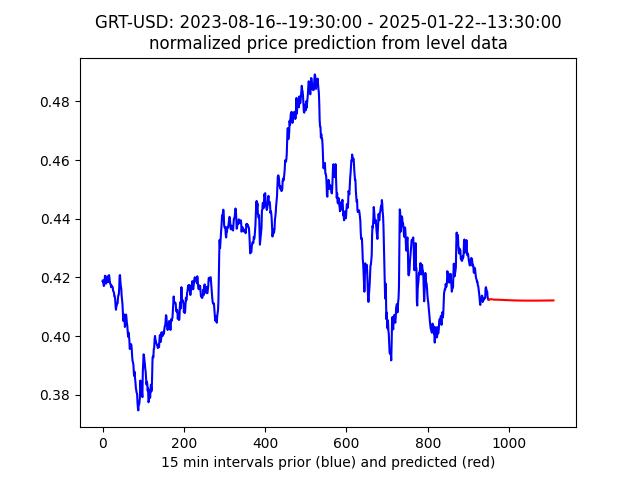
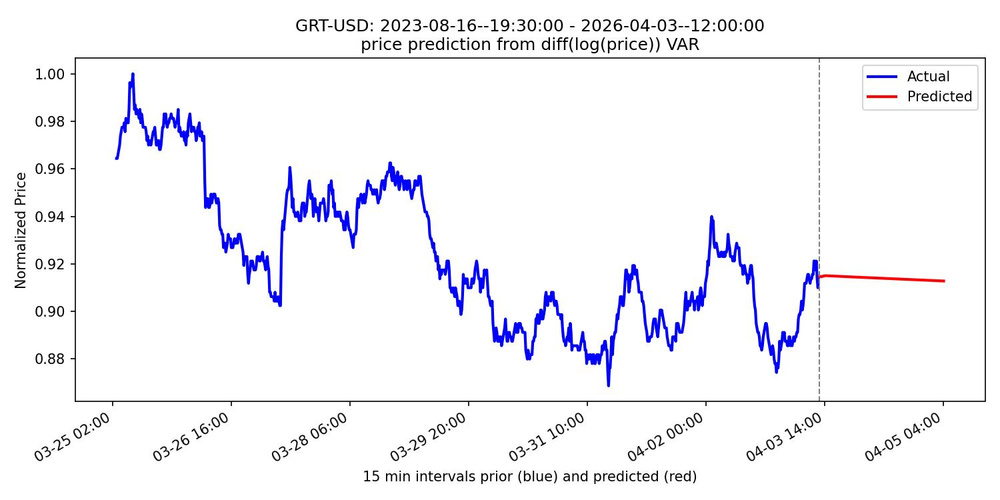
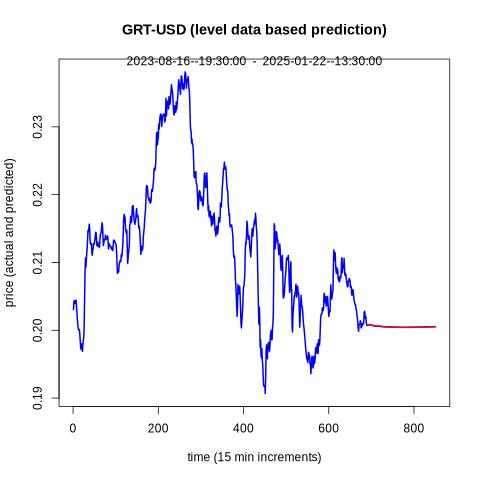
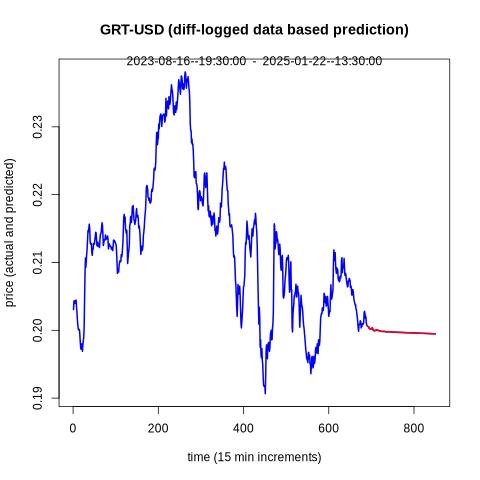
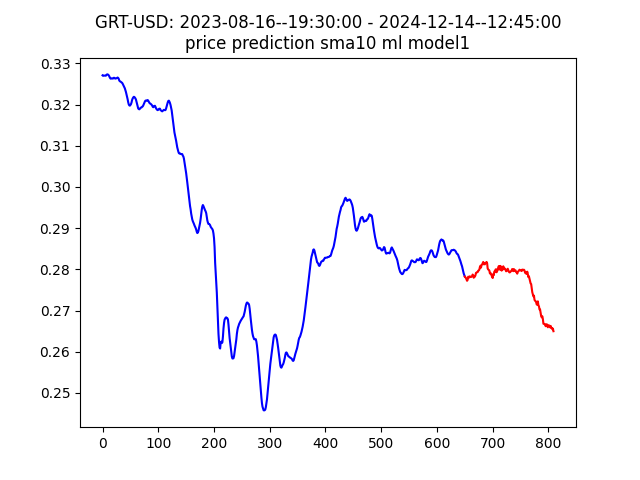
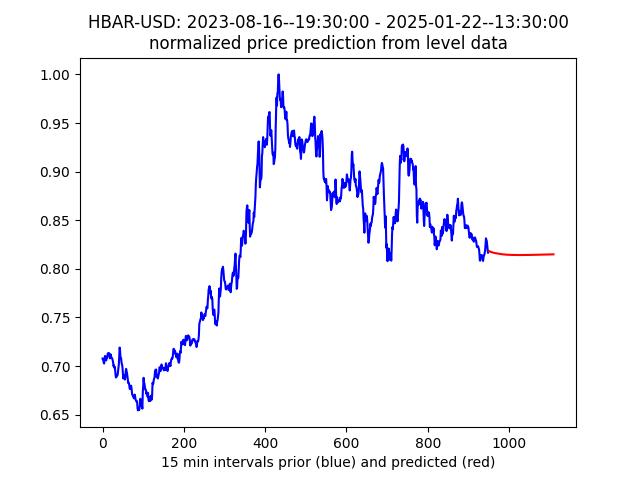
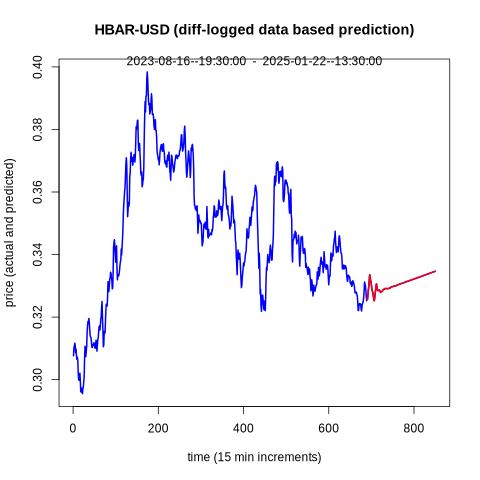
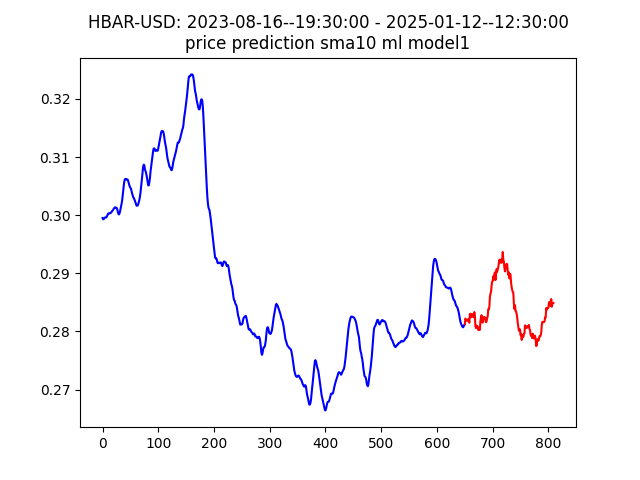
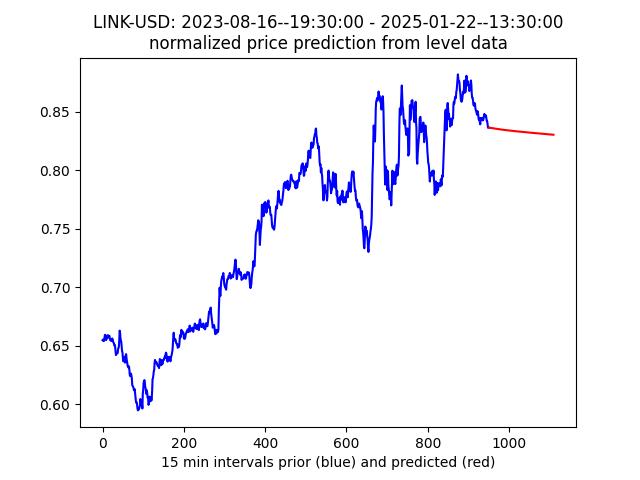
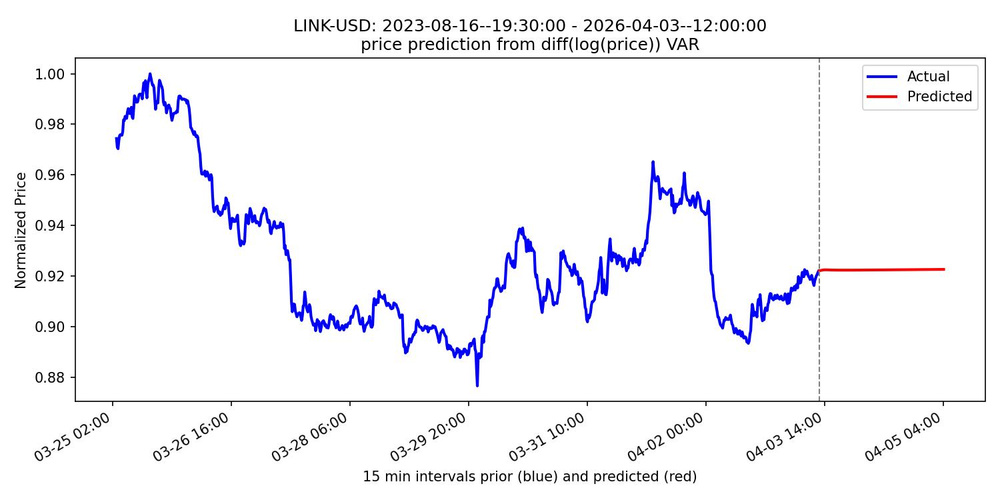
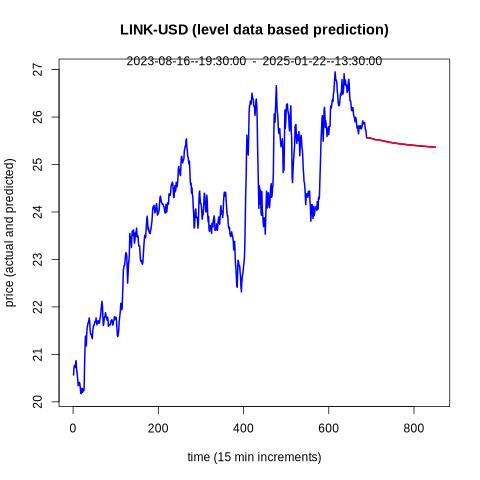
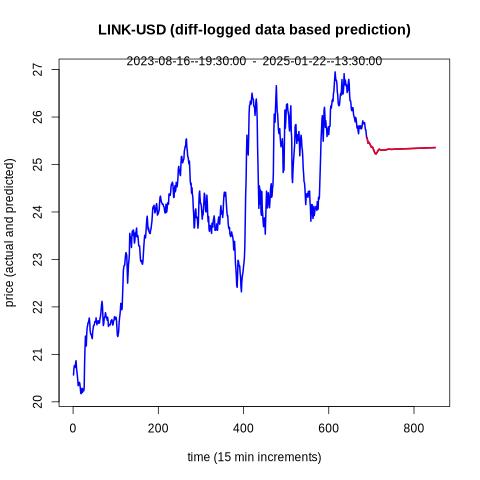
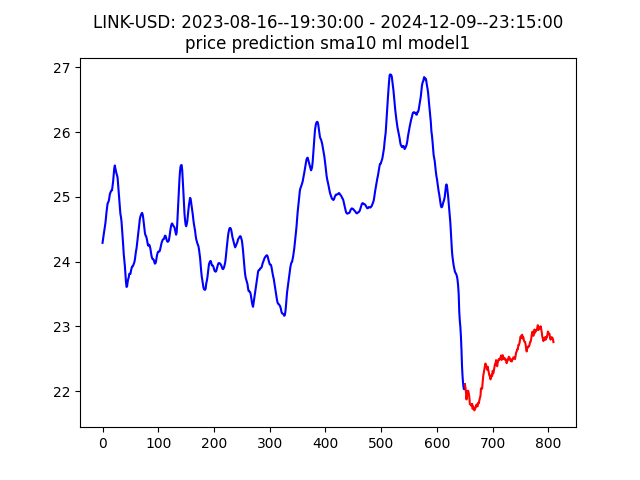
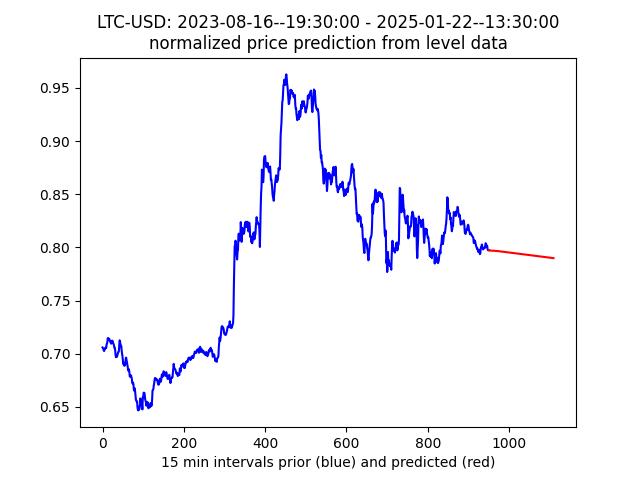
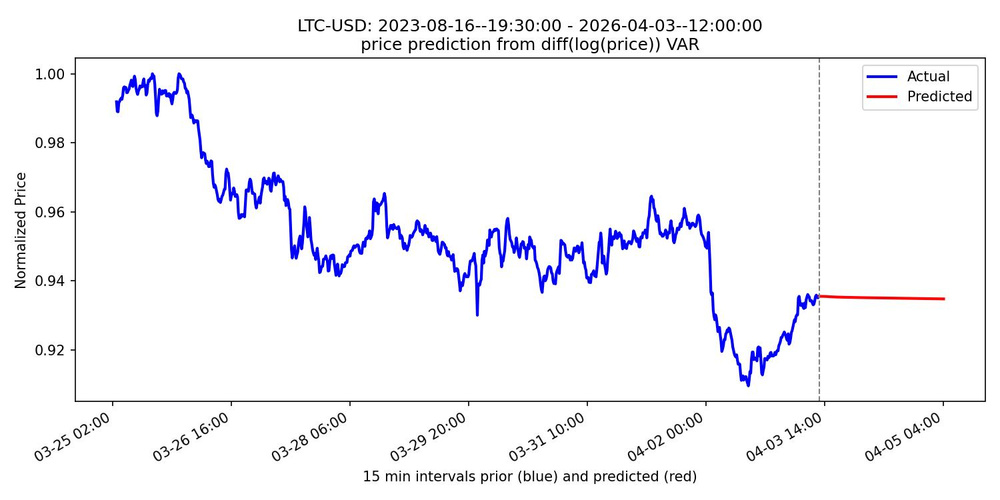
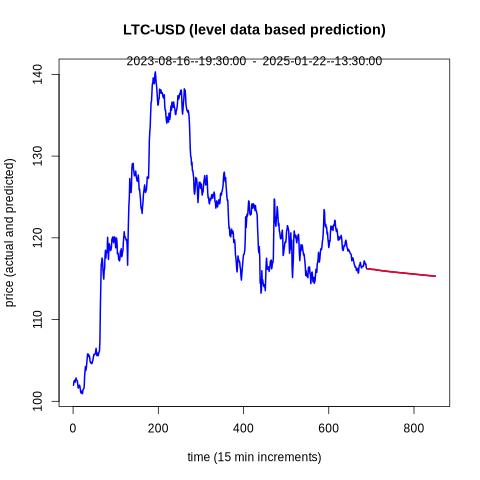
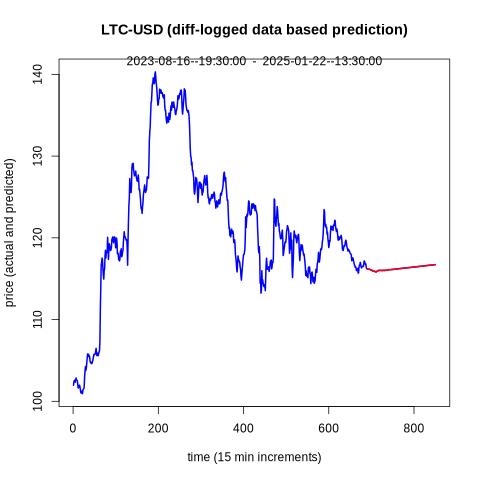
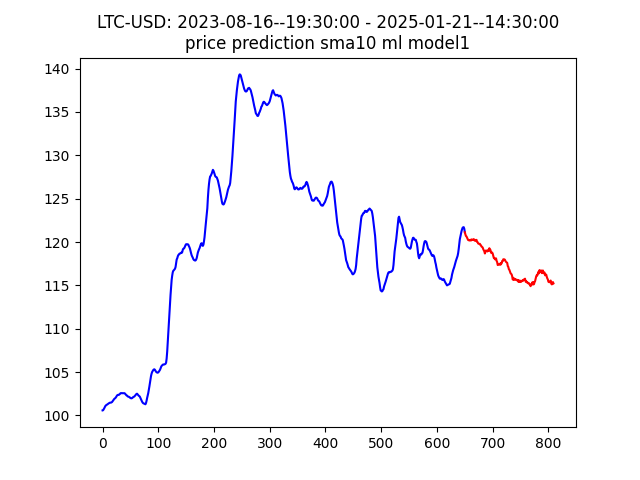
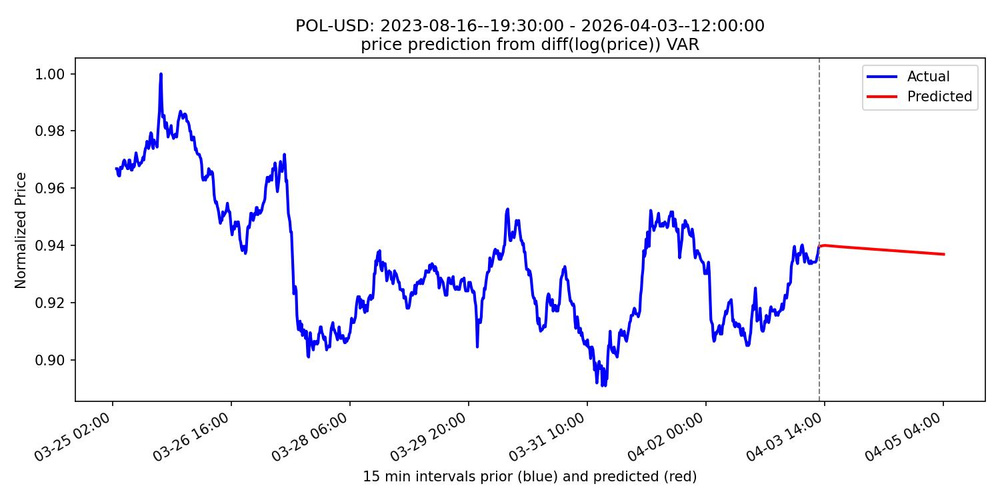
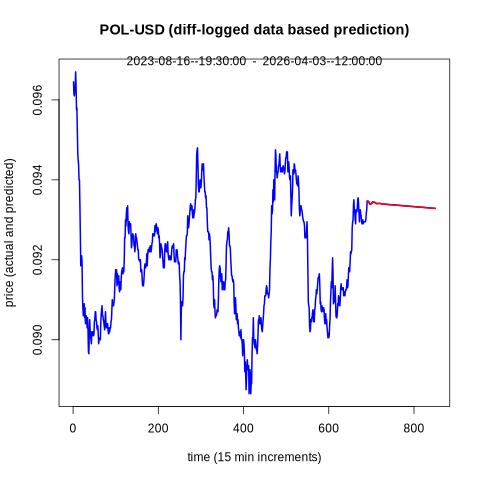
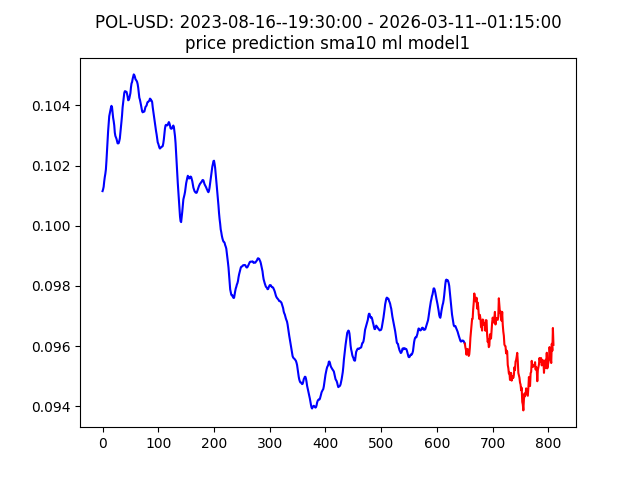
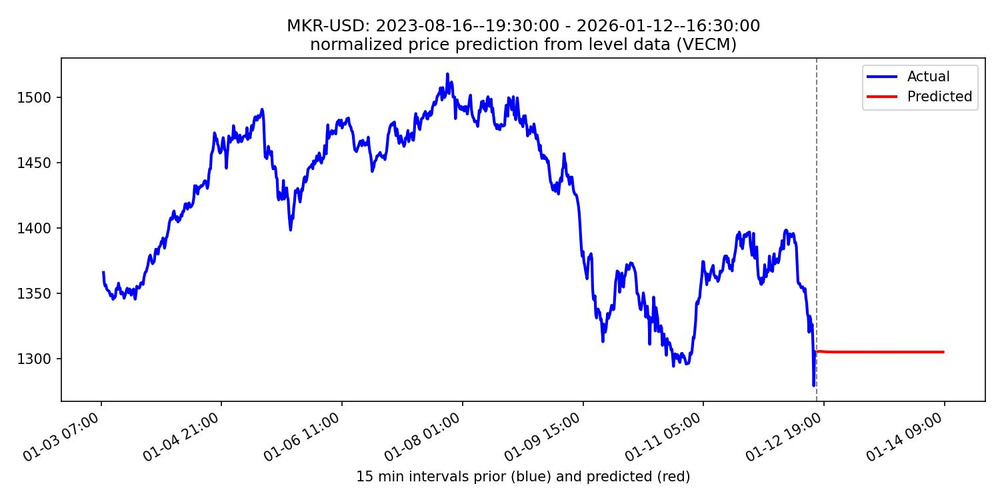
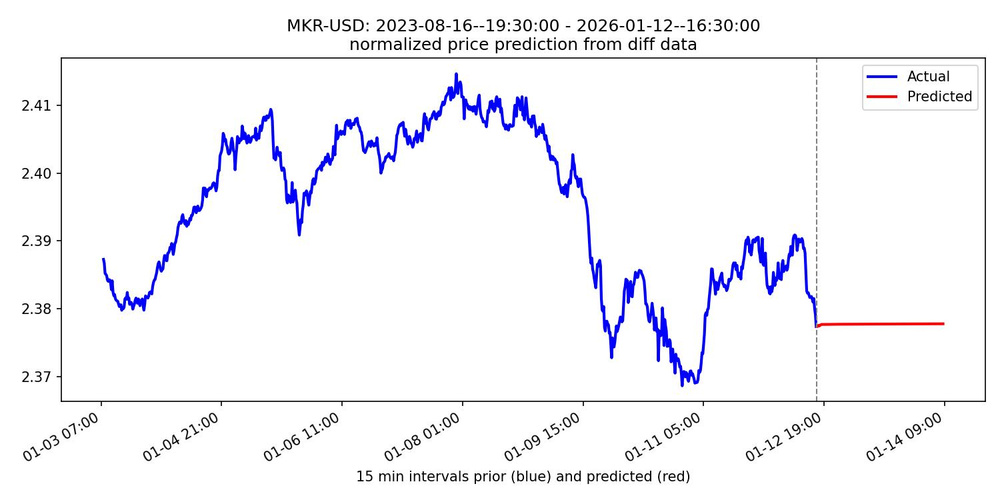
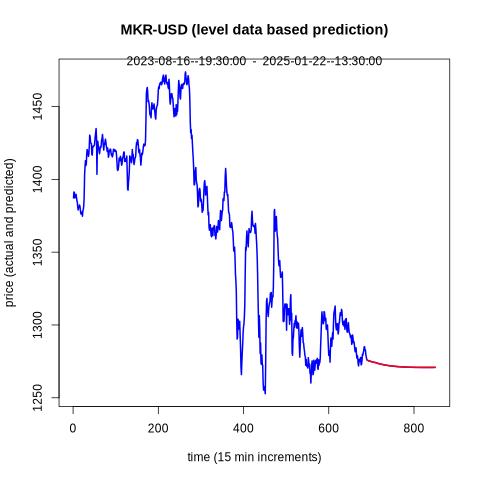
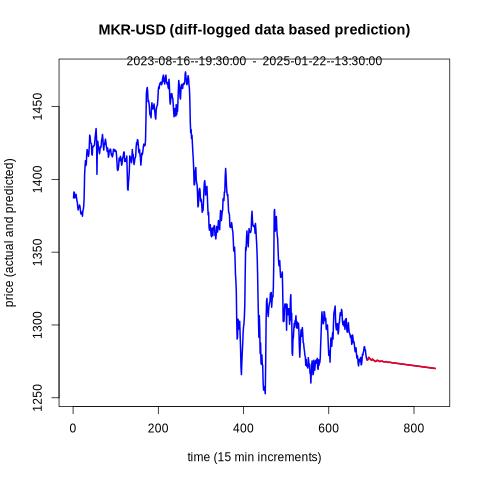
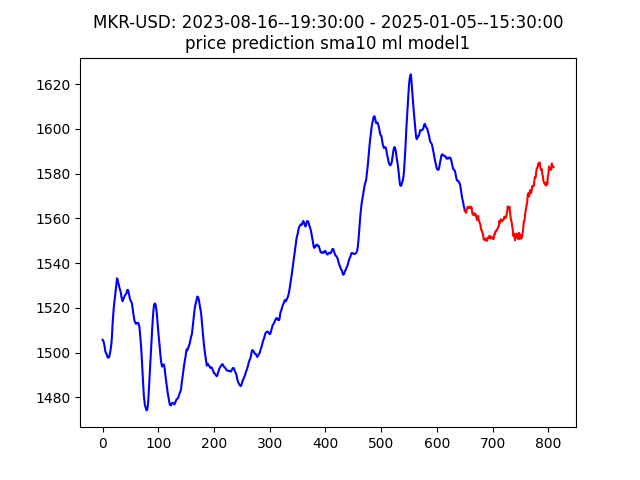
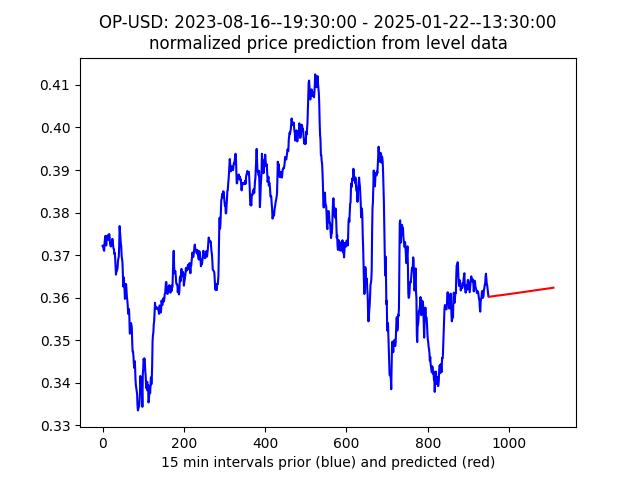
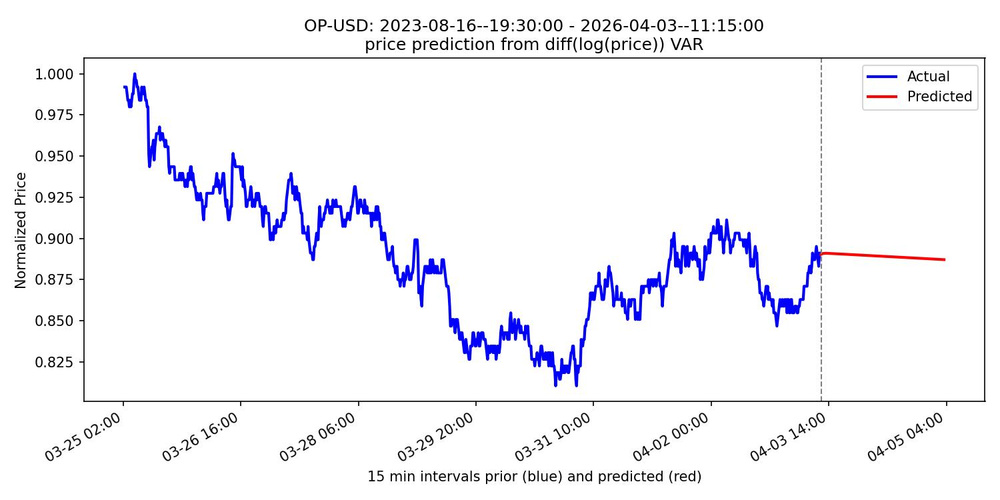
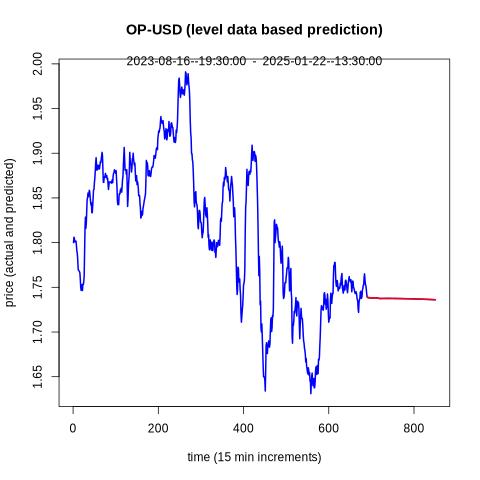
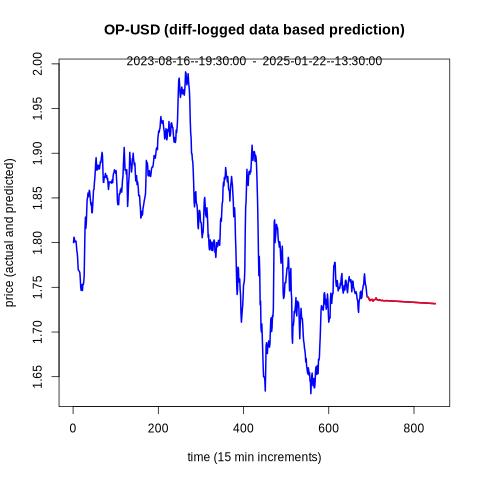
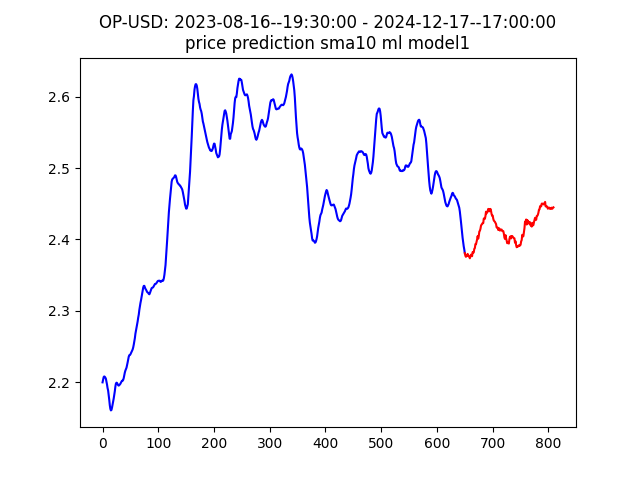
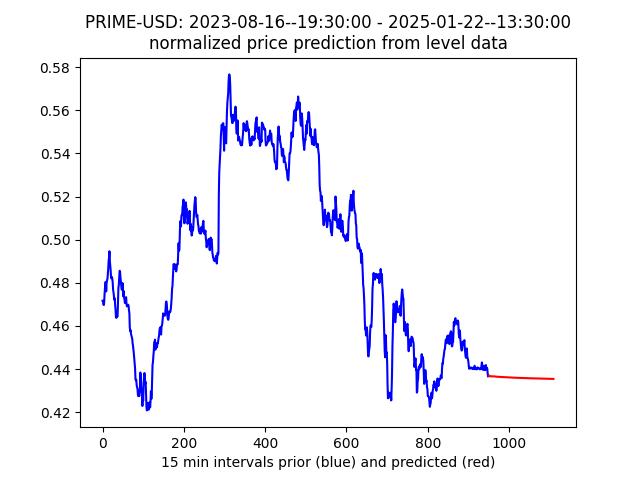
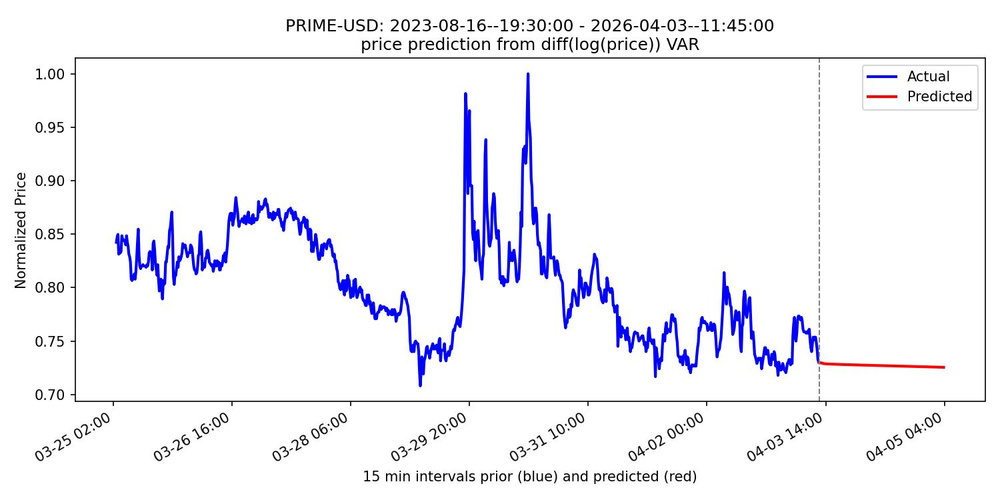
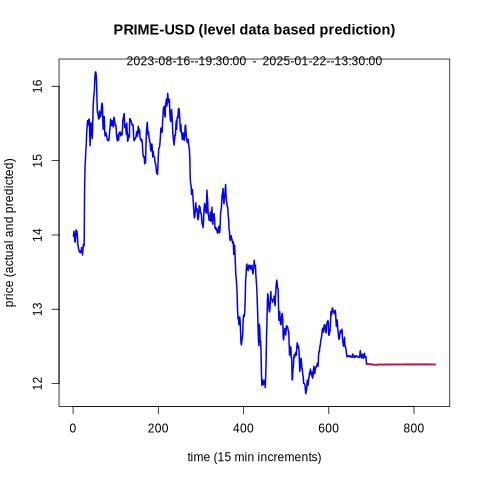
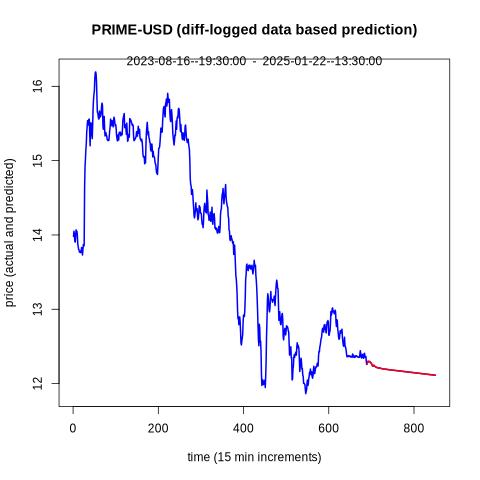
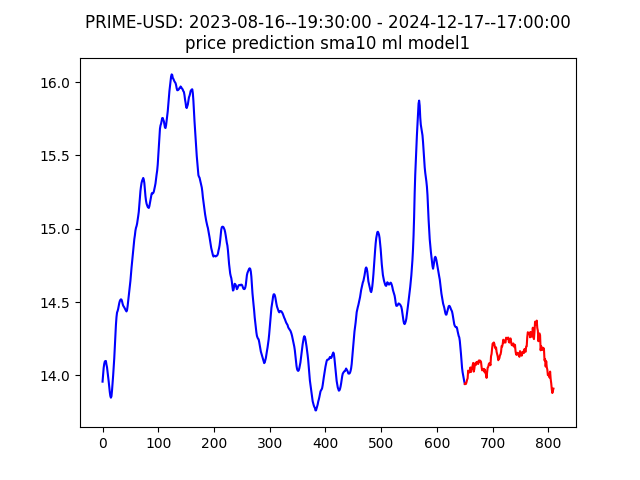
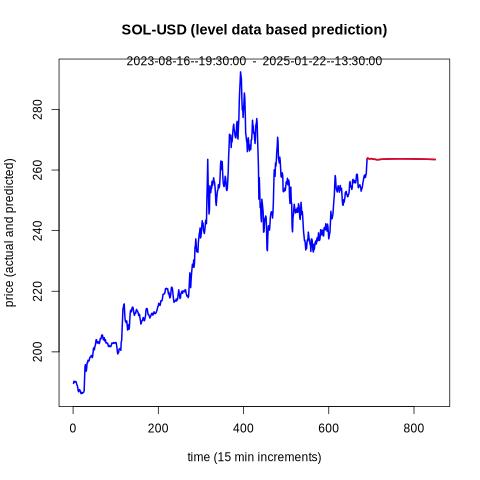
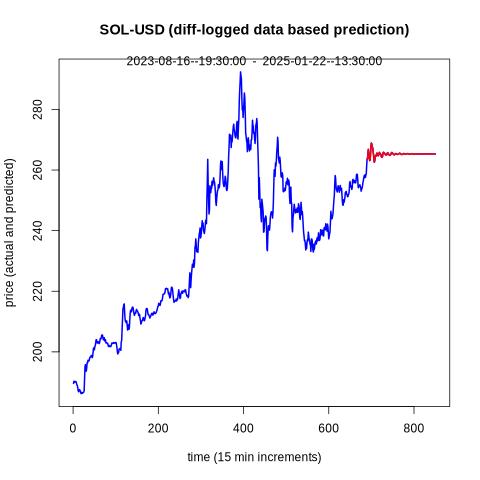
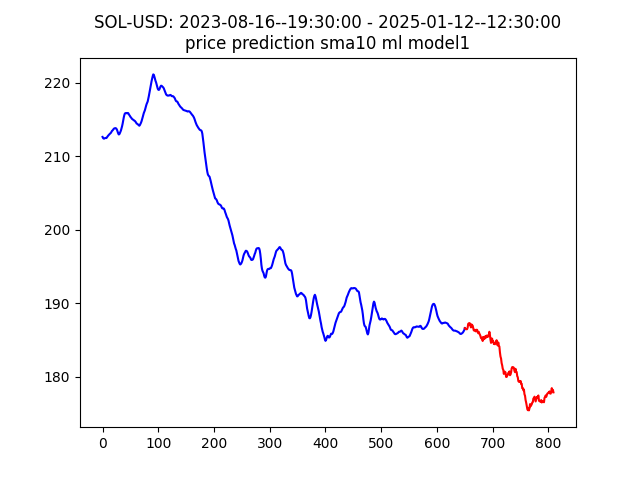
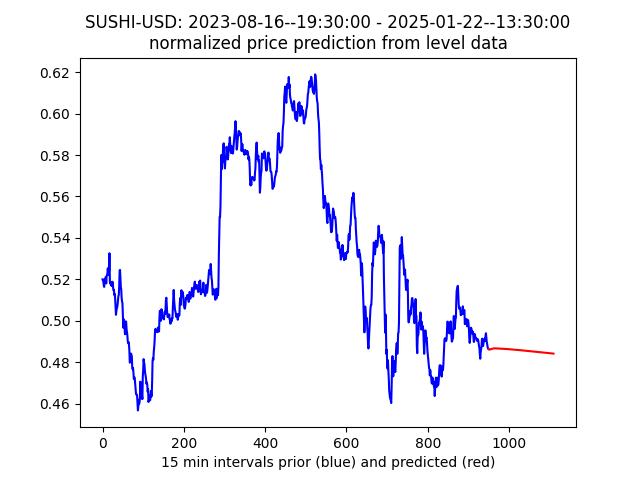
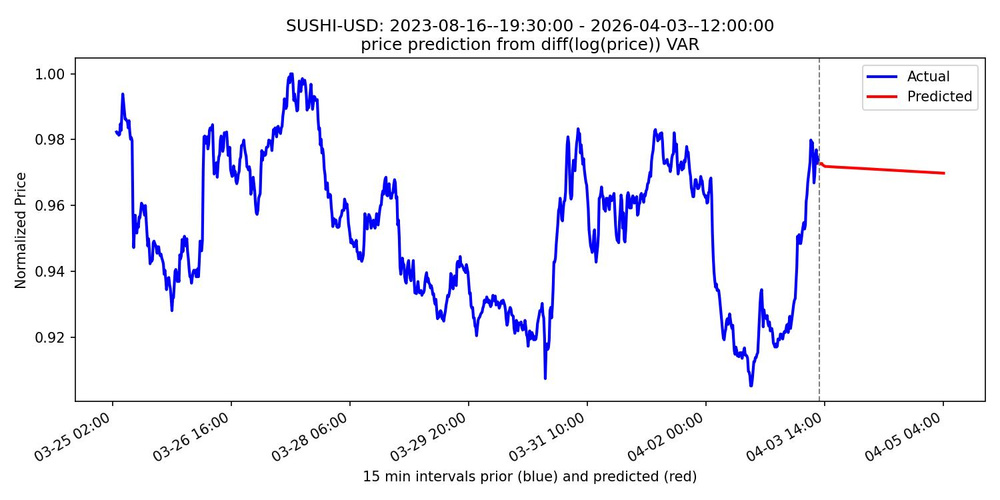
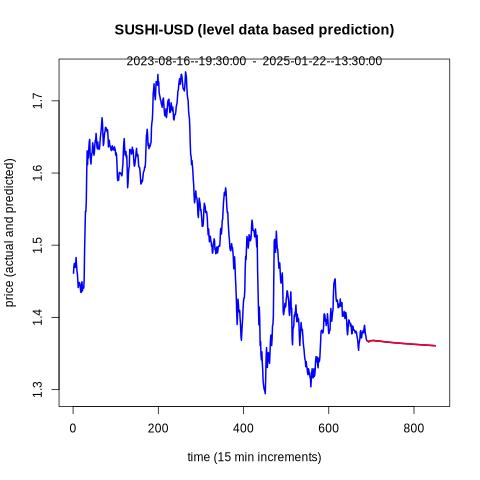
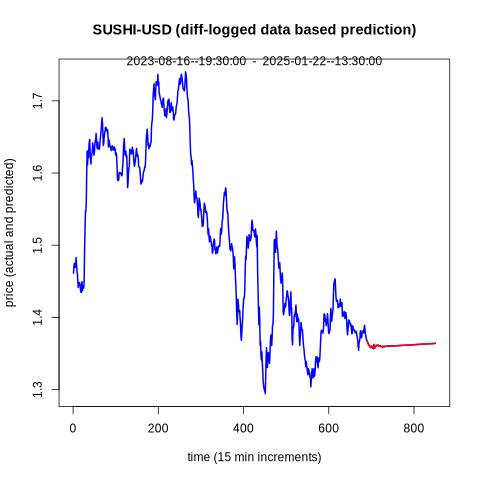
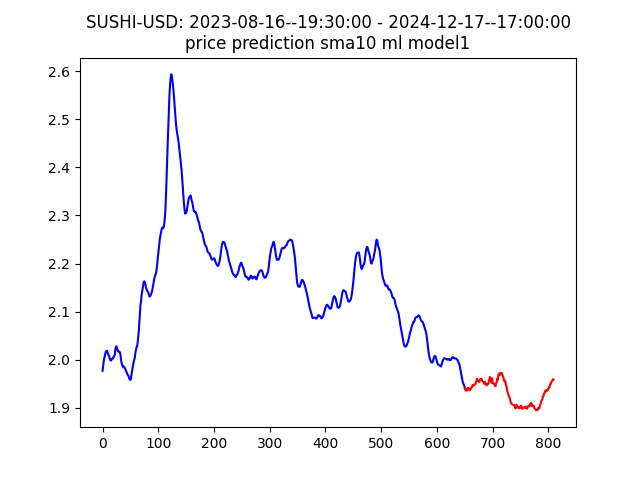
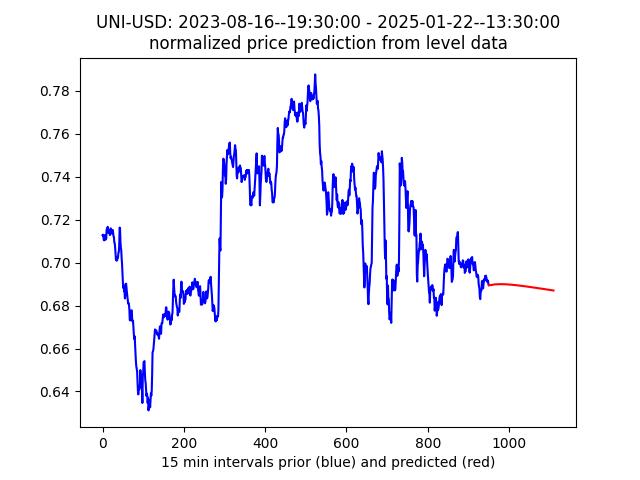
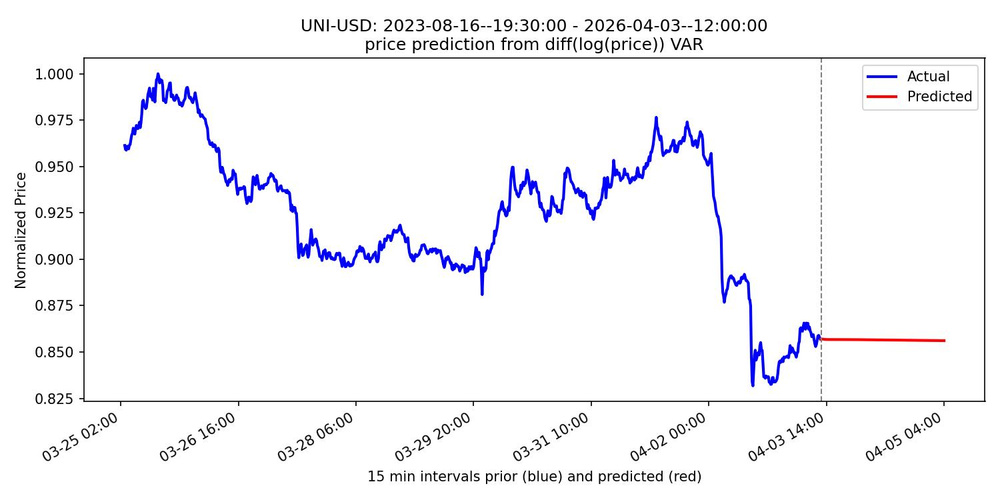
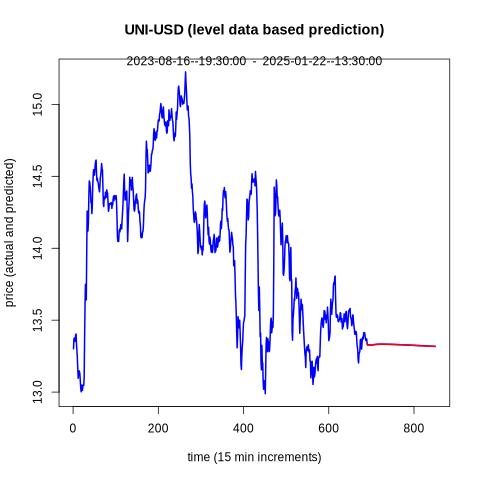
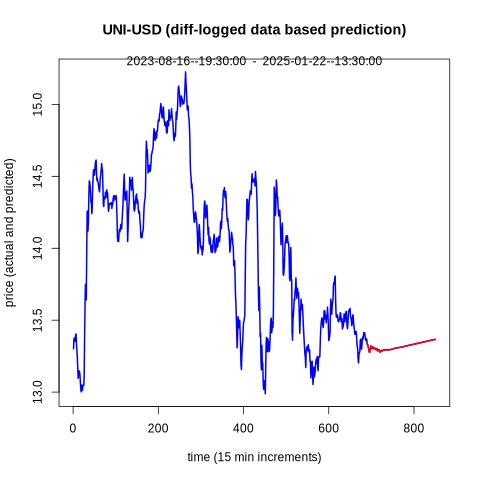
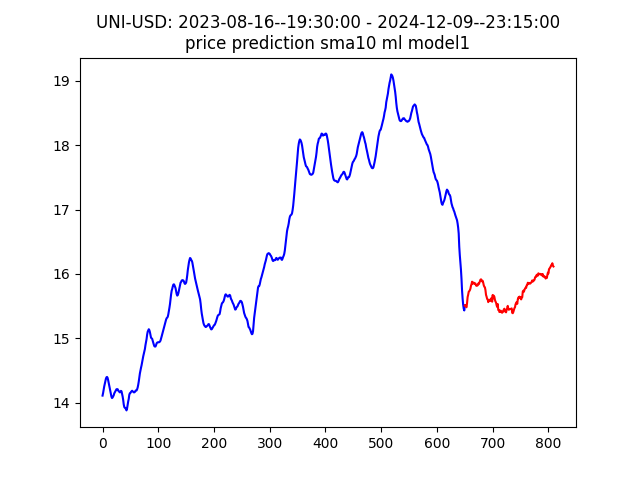
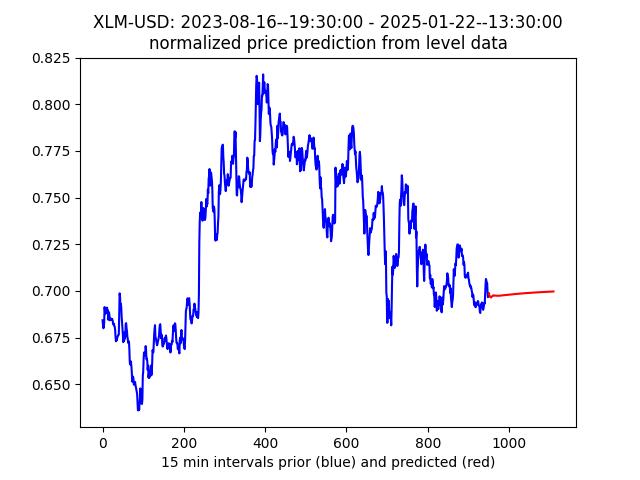
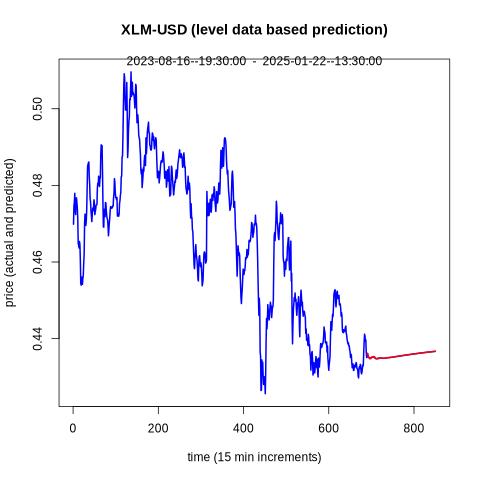
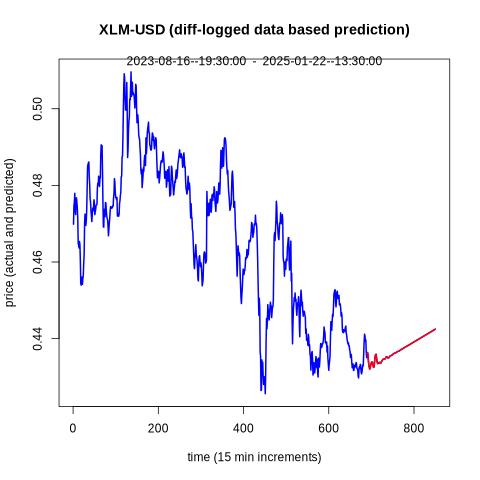
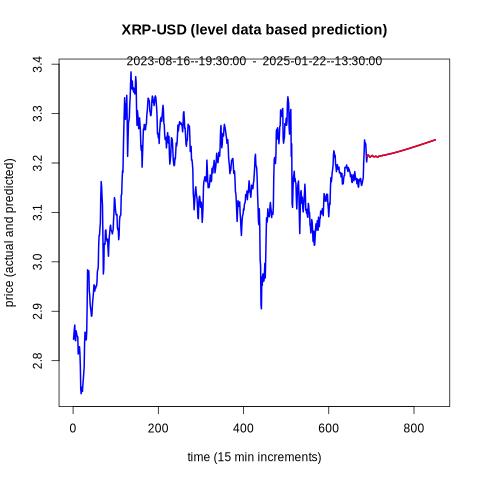
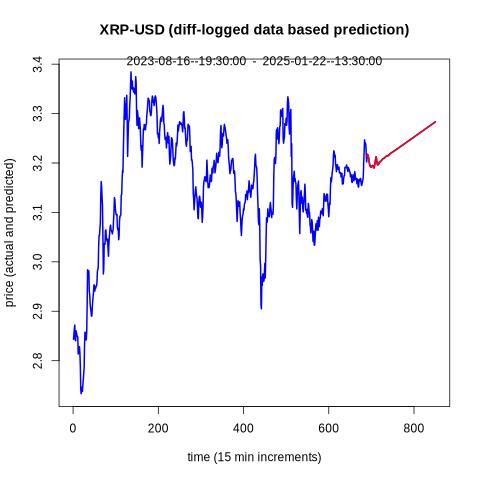
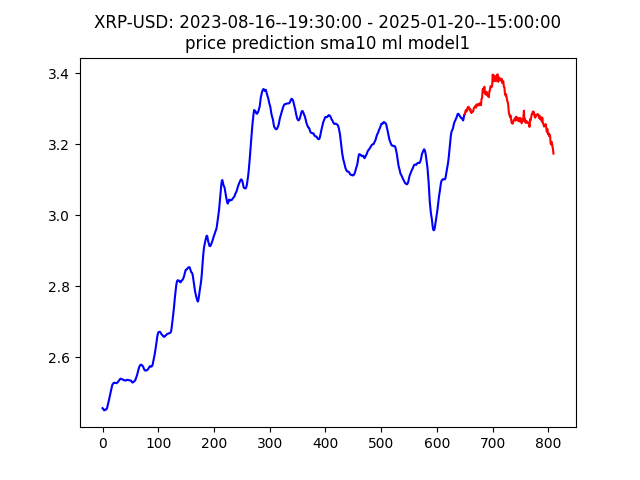
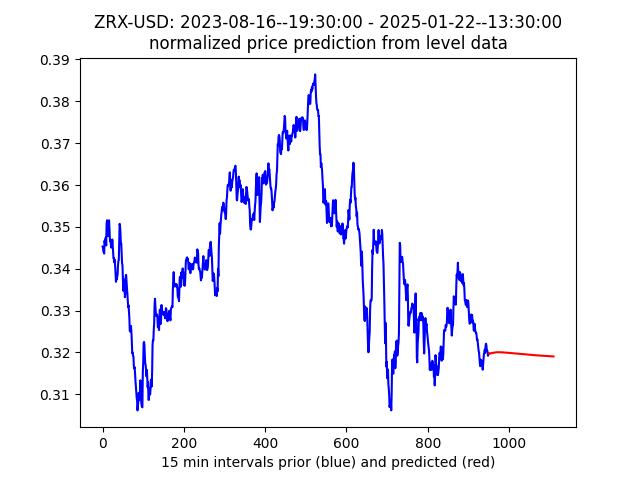
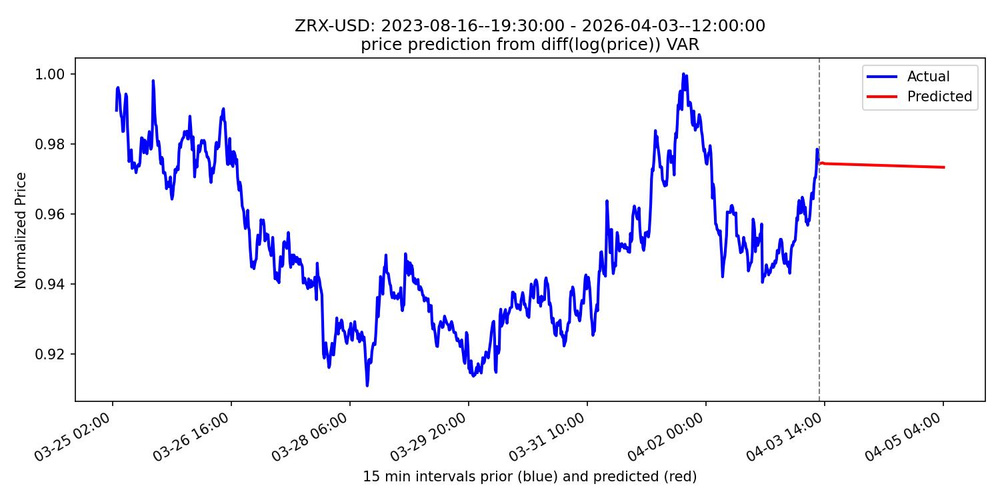
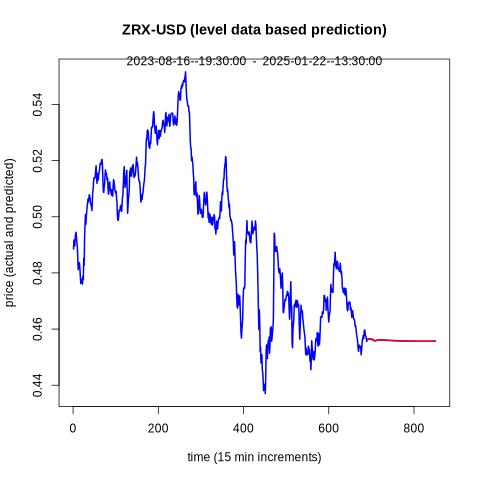
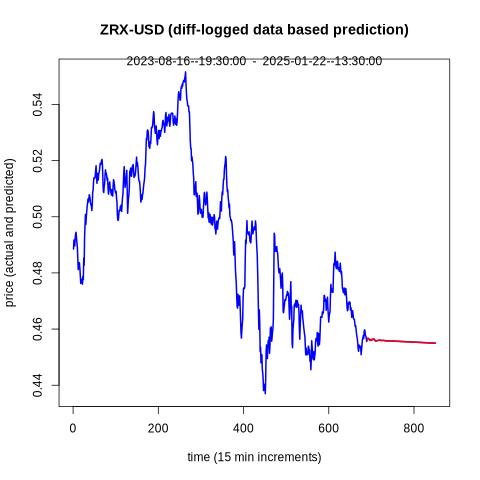
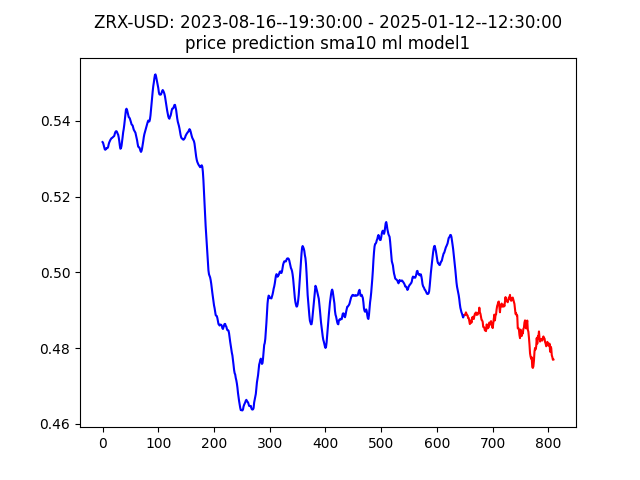
Currently we are supporting multivariate time series predictions for ADA, ALGO, BAT, BCH, BTC, DOGE, DOT, ETC, ETH, HBAR, LINK, LTC, POL, MKR, OP, PRIME, SOL, SUSHI, UNI, XLM, XRP, ZRX assets per the high volume list. Support for more assets will be rolled out, together with functional and graphical enhancements. The prediction plots above may be used cautiously to aid day to day short term buy and sell strategies, akin to penny stock trading. Note that both involve significant risks including total investment loss. In some cases, the VAR based and machine learning model predictions modeling residual values, may not agree. This is not a bug but should inform caution regarding the quality of the prediction, as the two modeling approaches are fundamentally different in nature. Predicted data is displayed in red. The generated plots display the corresponding date interval for the reference (observed) data. Some of the plots display normalized price data to [0,1] interval, to more readily reflect percent change. The first differences of the log of the time series data are used as an approximation for residuals. A VAR model is then used for constructing predictions from price, volume, and vwap data and an exp() operation is applied to recover price data from the result. An ML based predictor based on MLP has been integrated. For this approach, the data must be put into a tabular form, whereby each row has price, volume, and vwap data for times 1 to J-1, and the training y vector has the outputs for time J. For more info see, the about section.
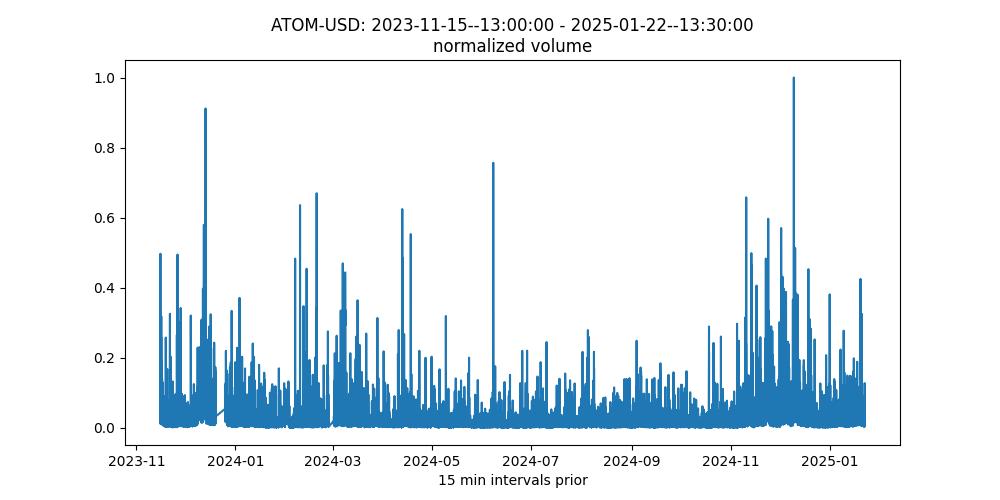
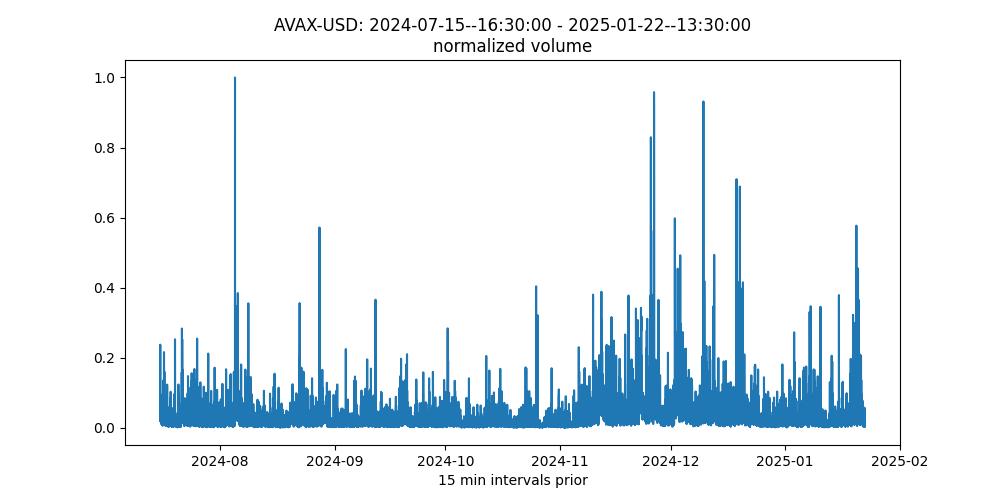
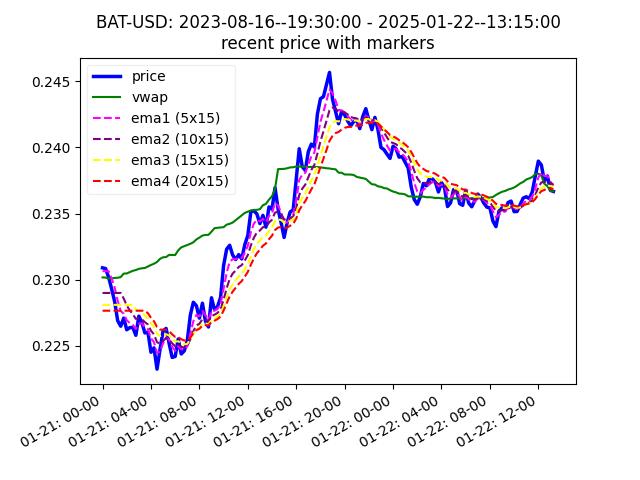
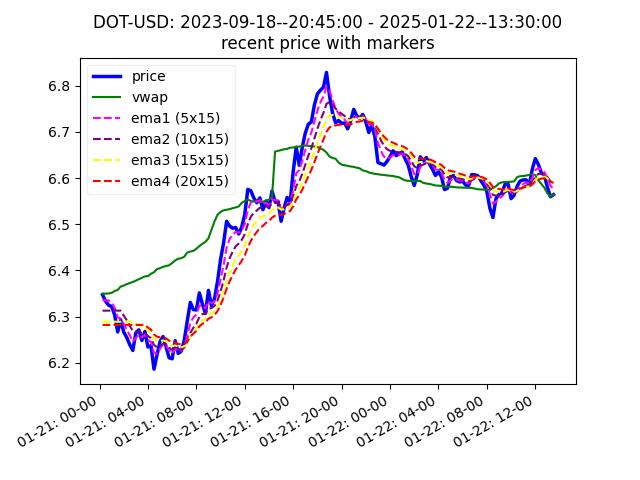
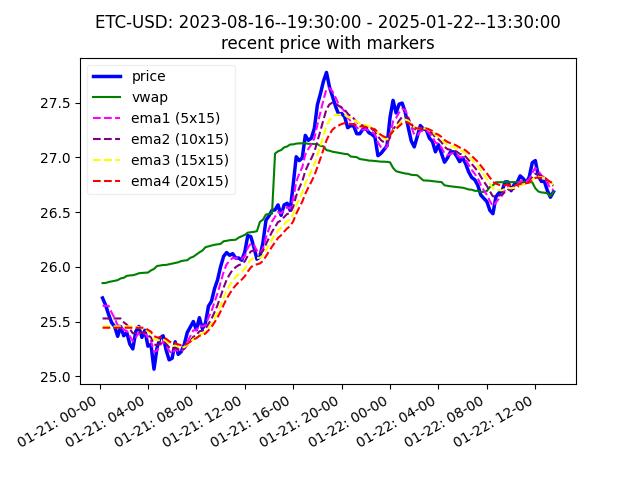
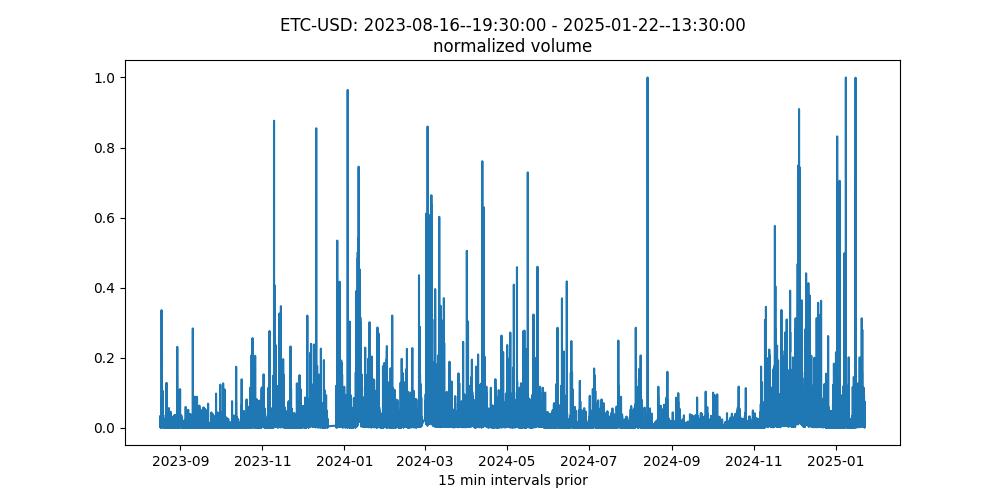
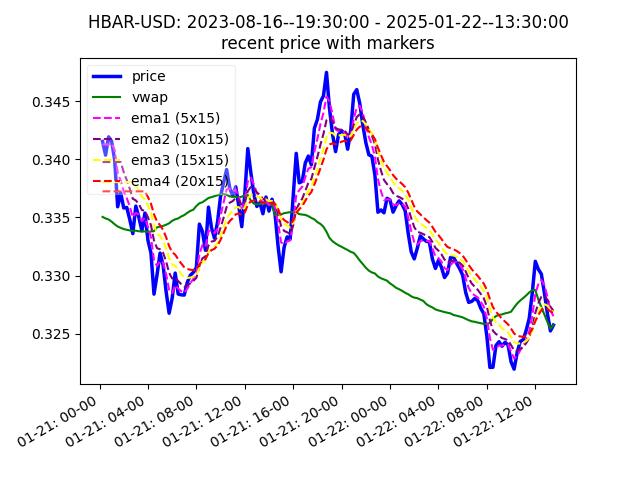
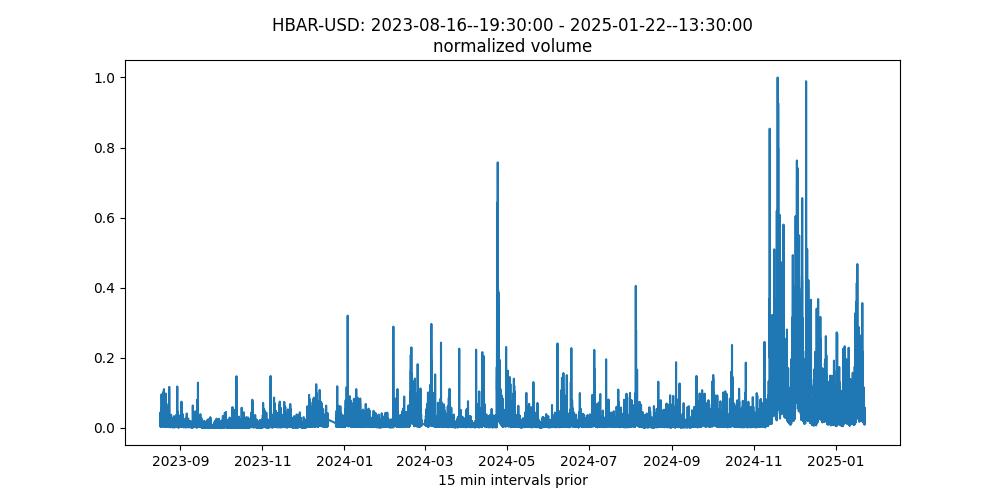
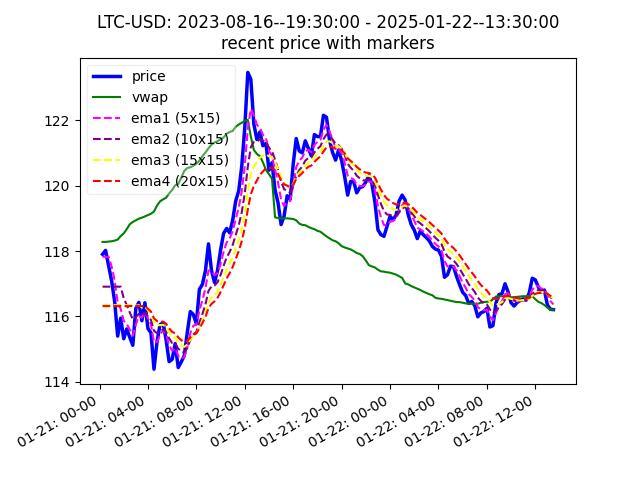
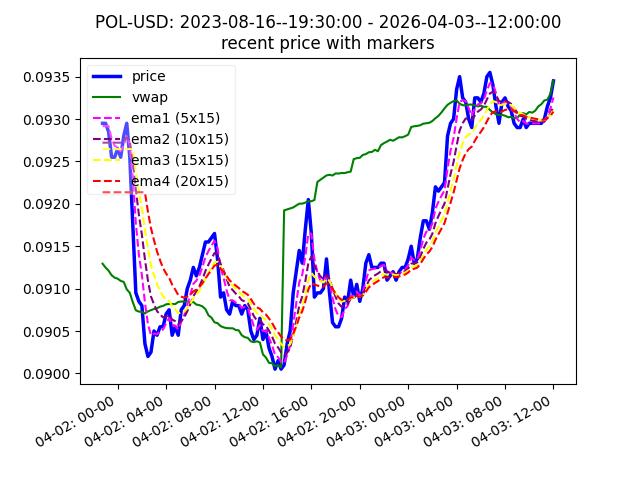
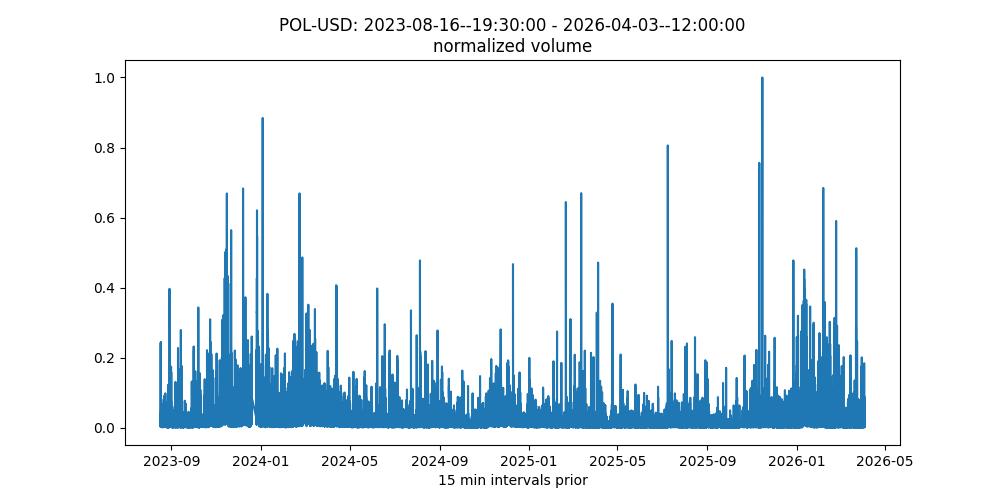
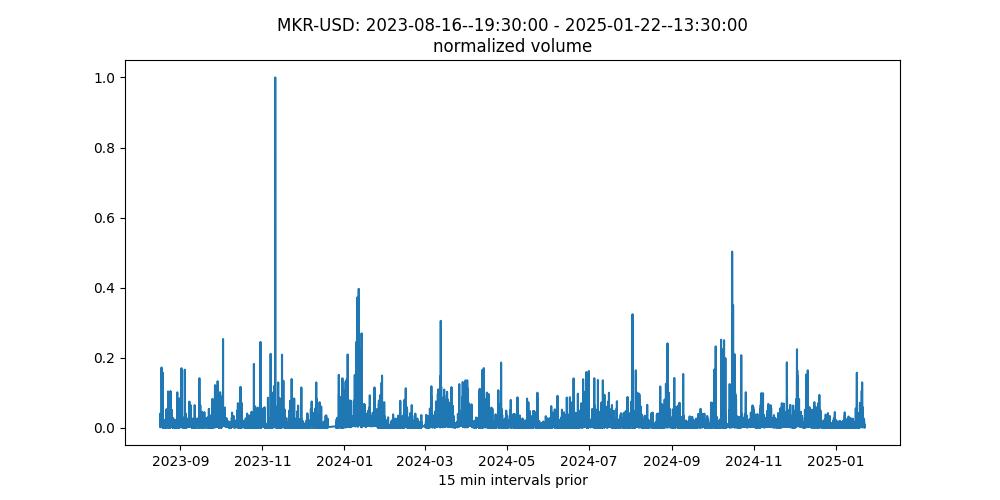
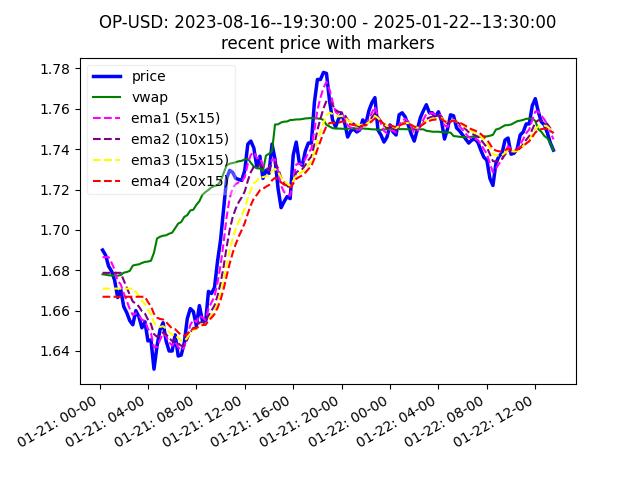
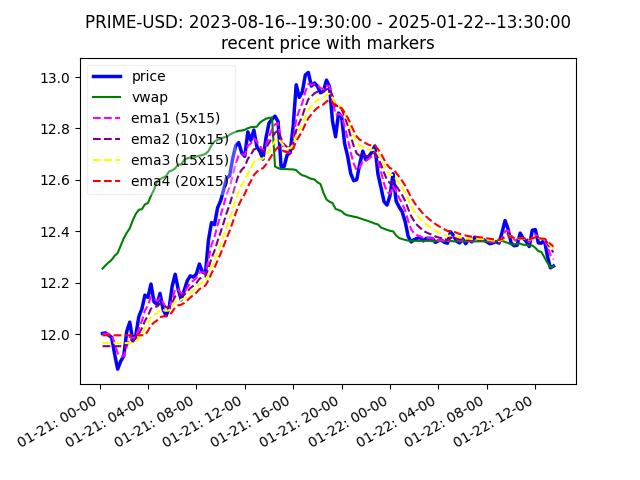
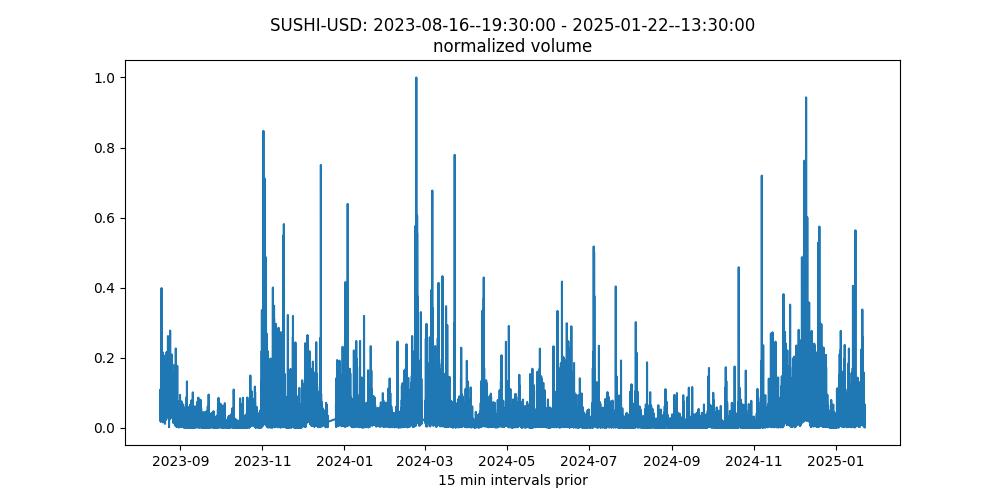
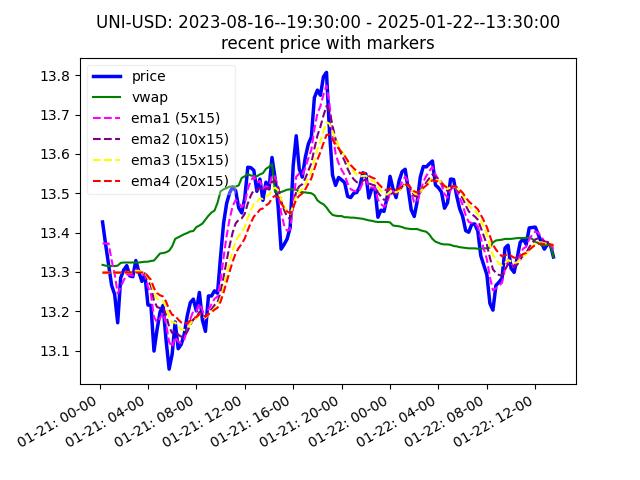
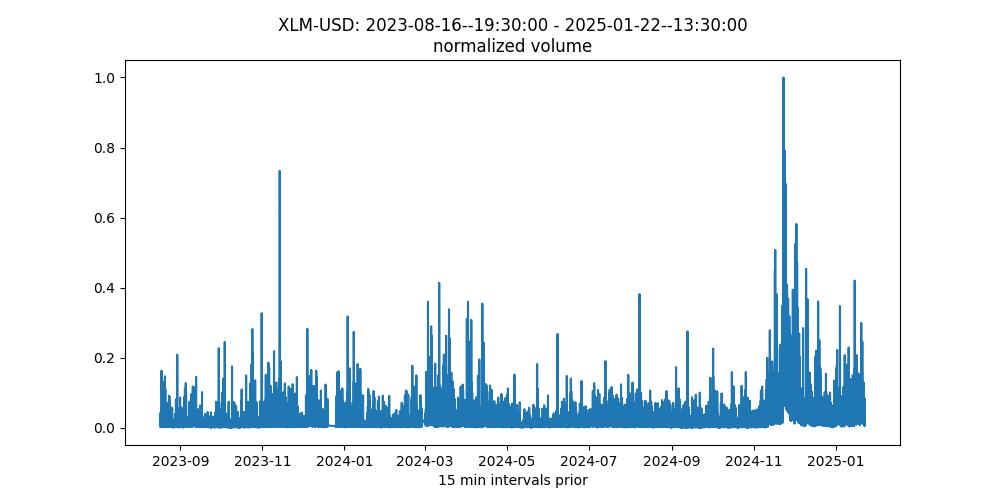
Wondering how to make use this data? You may monitor the provided near term price and volume behavior to look for trends,
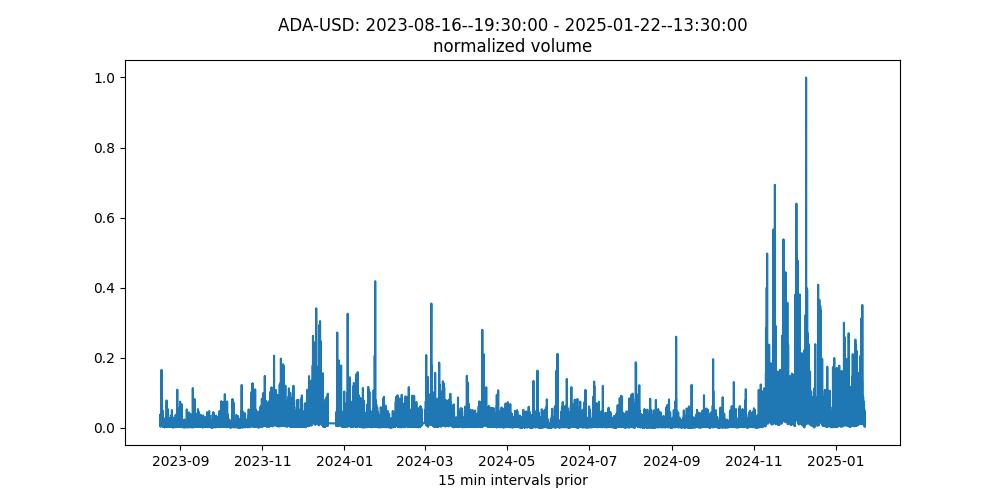
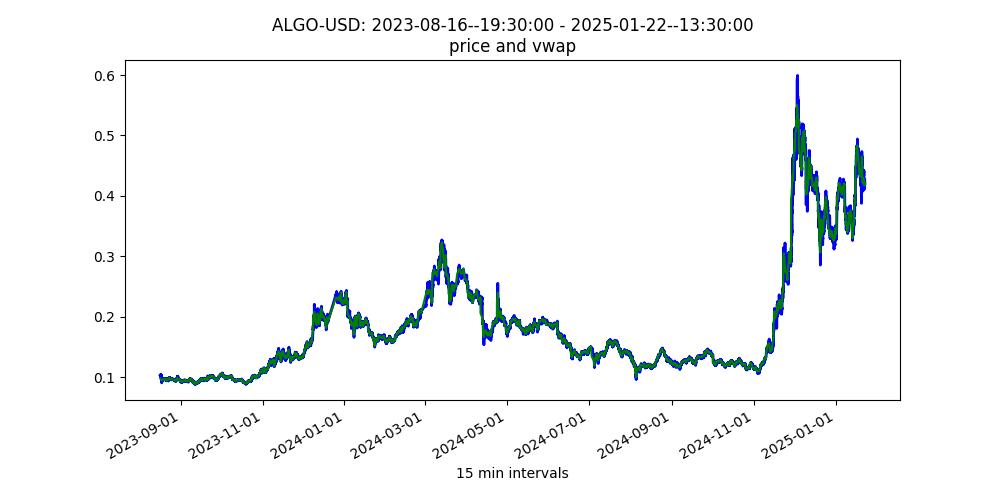
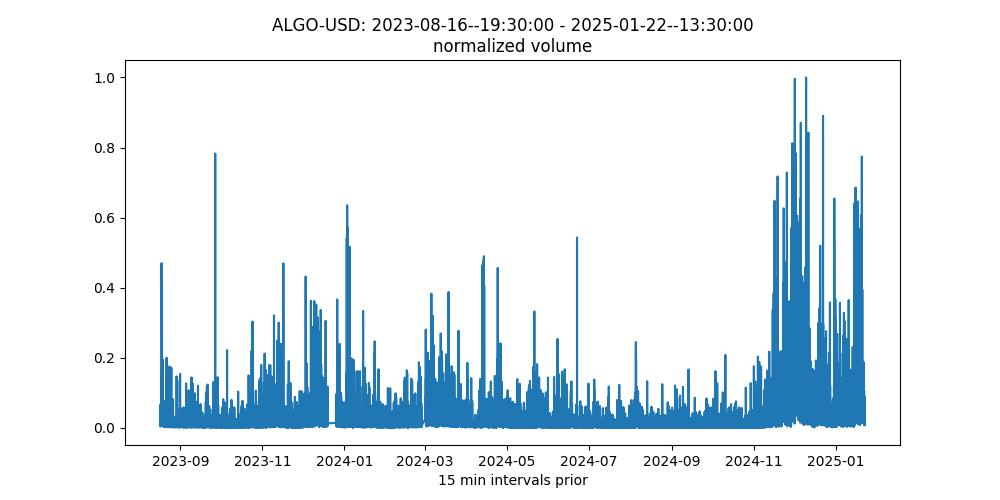
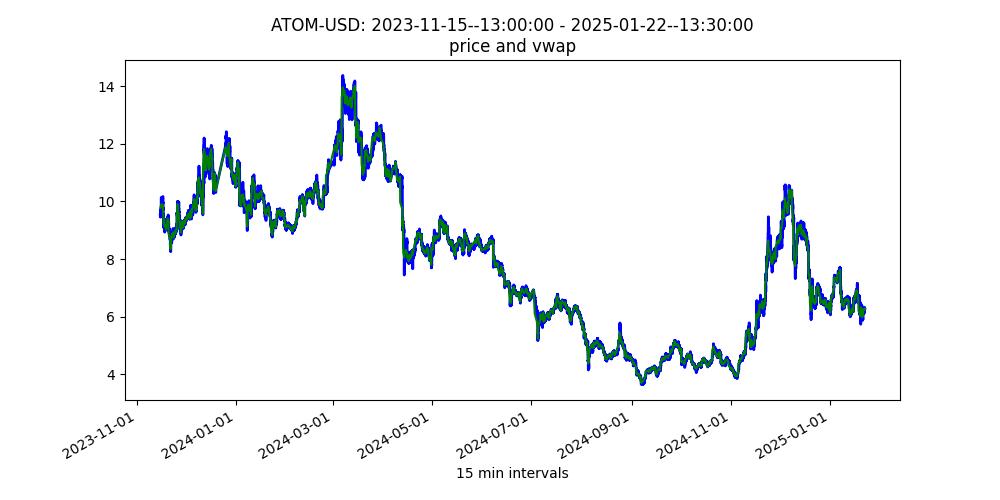
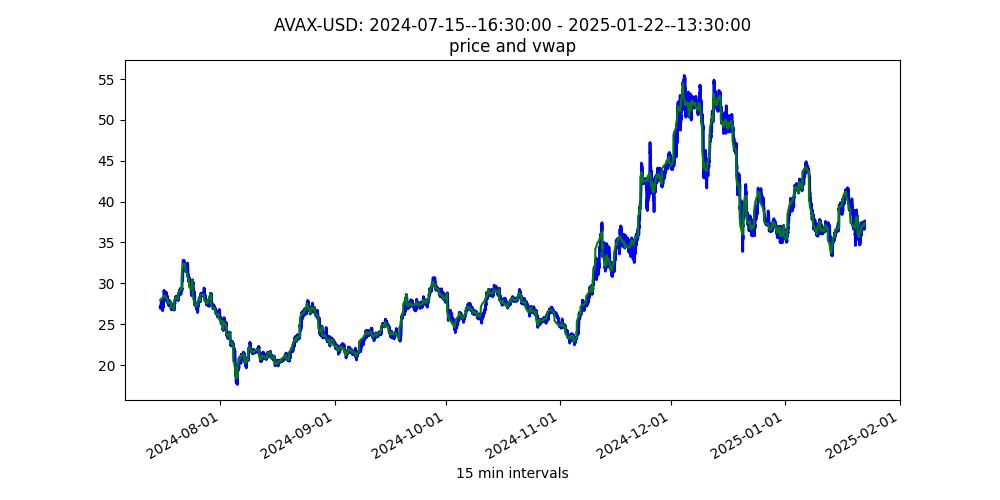
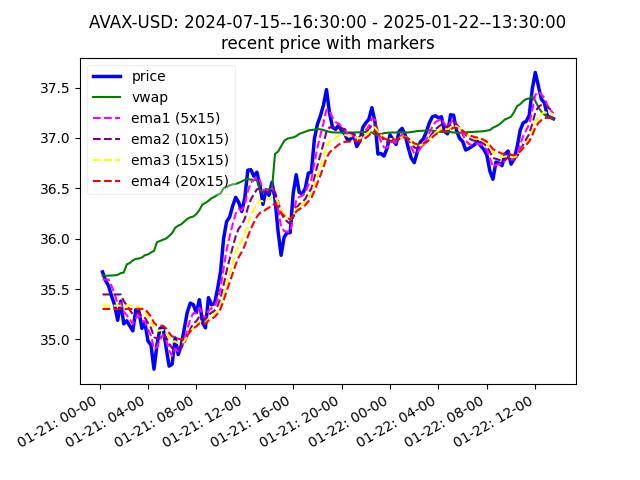
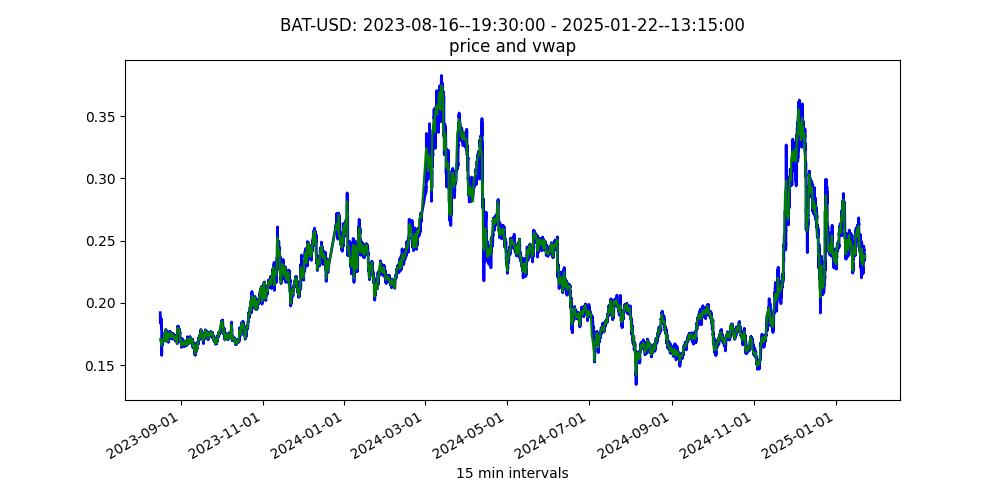
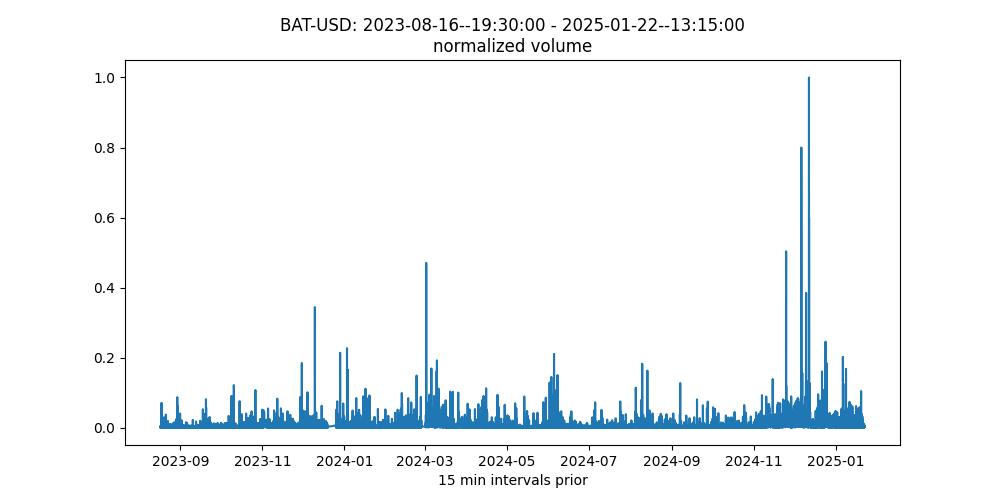
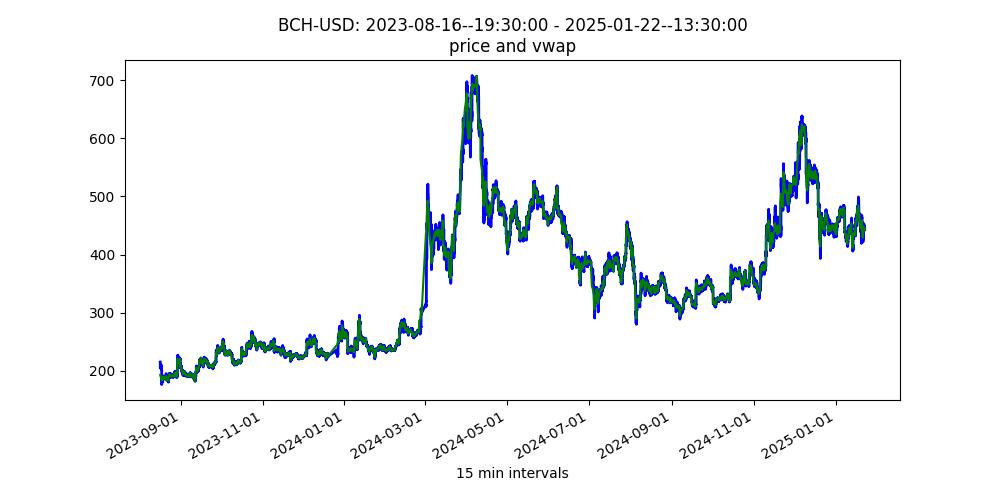
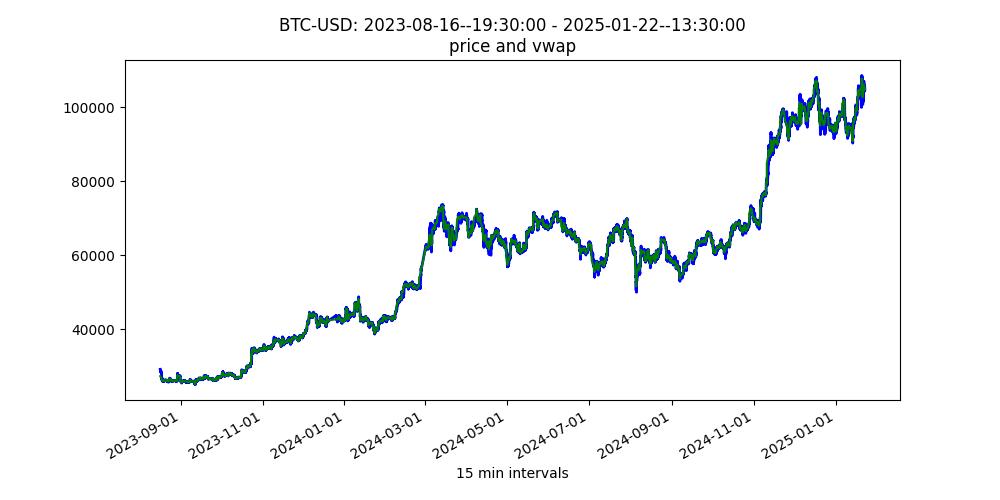
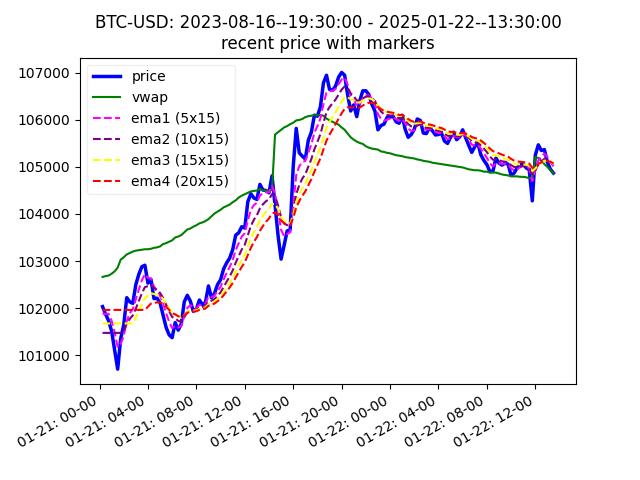
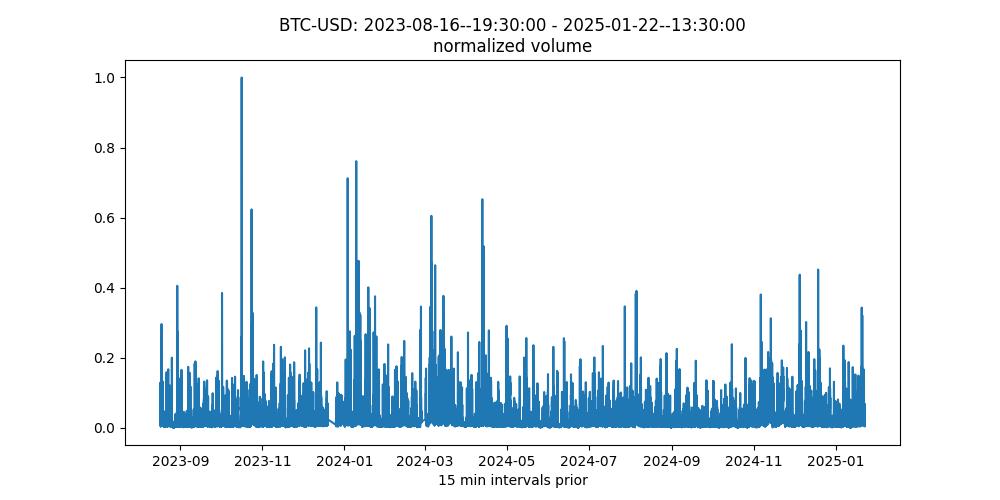
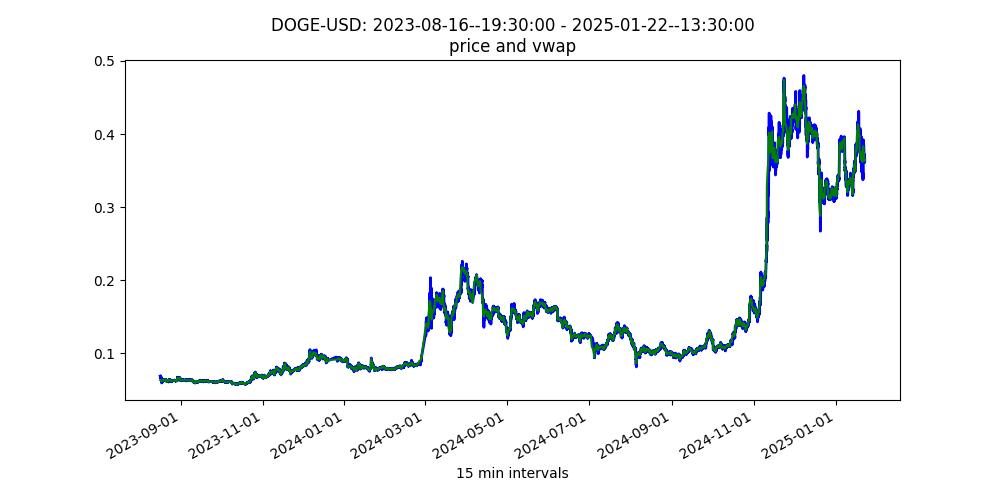
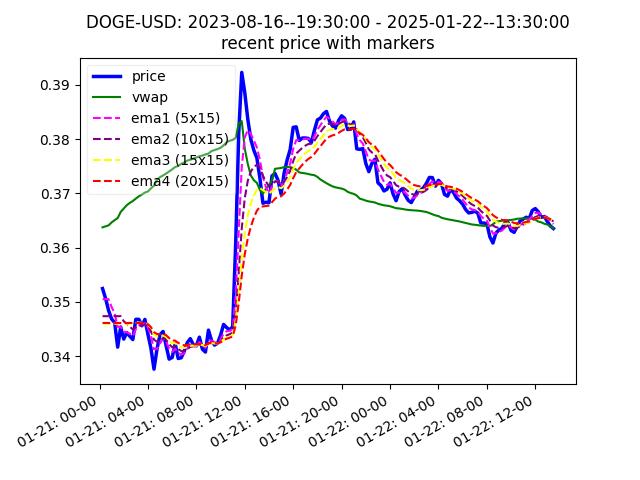
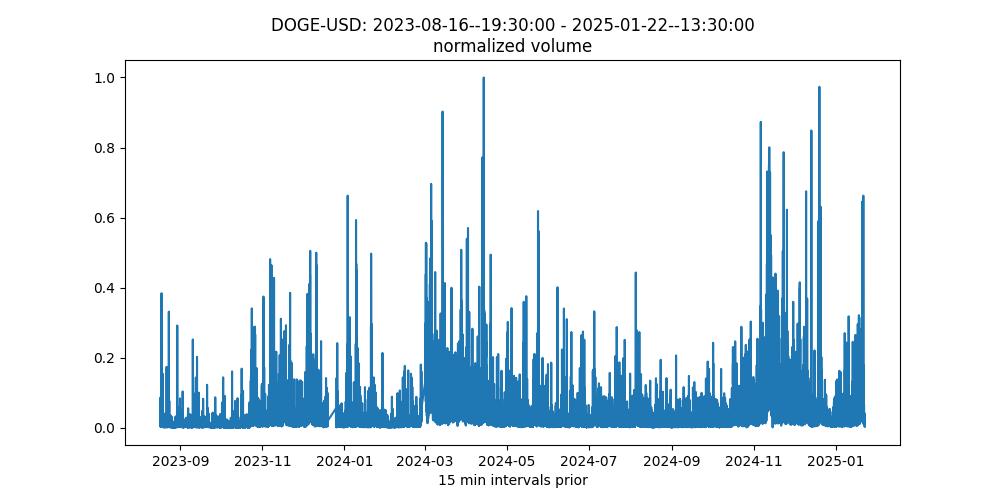
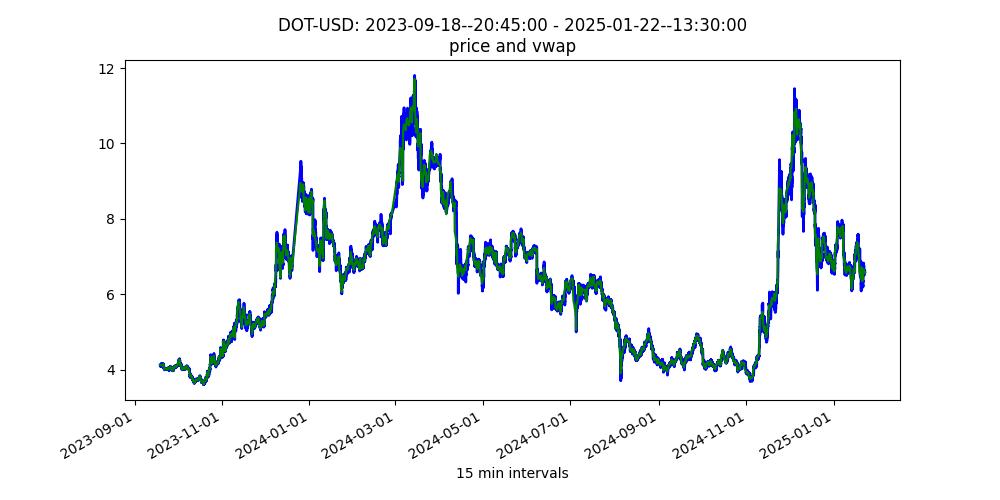
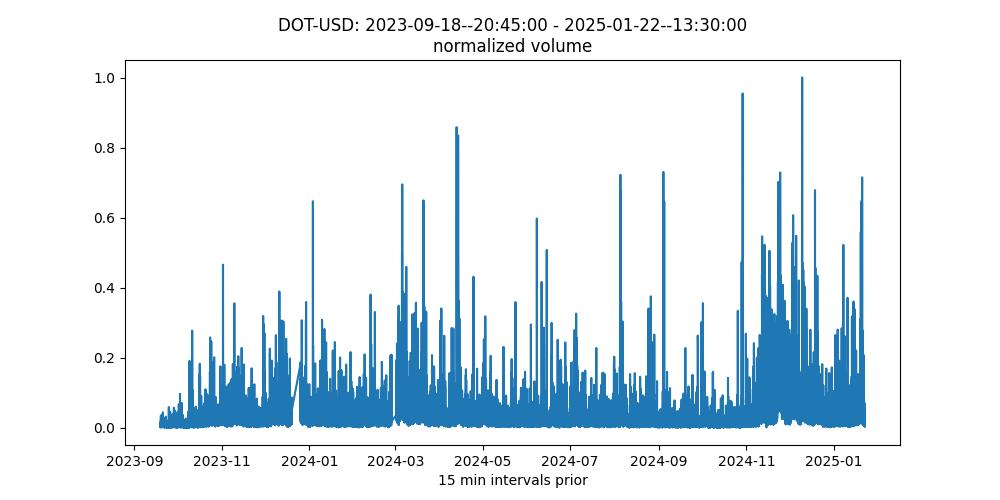
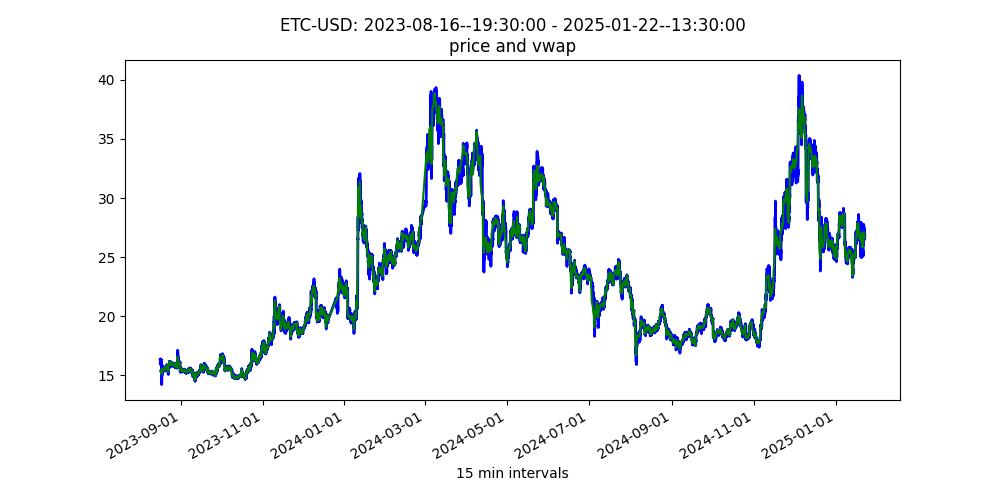
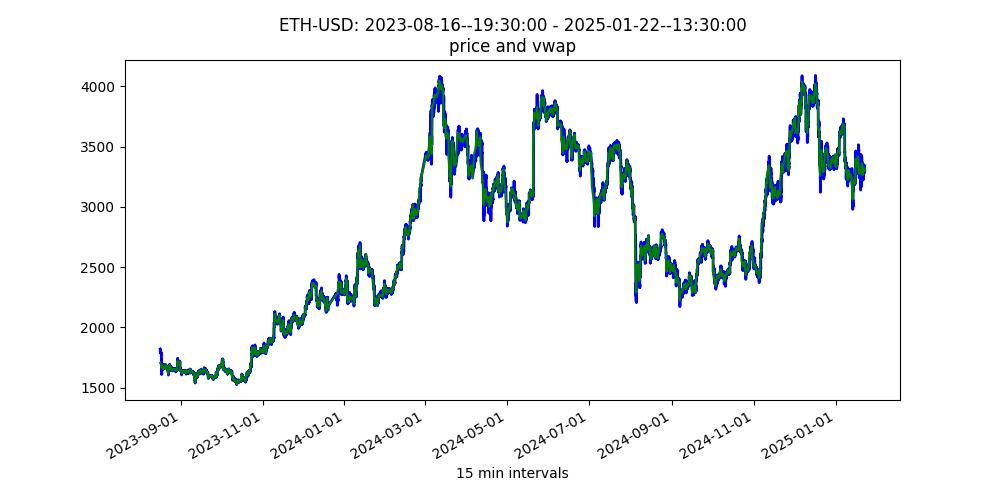
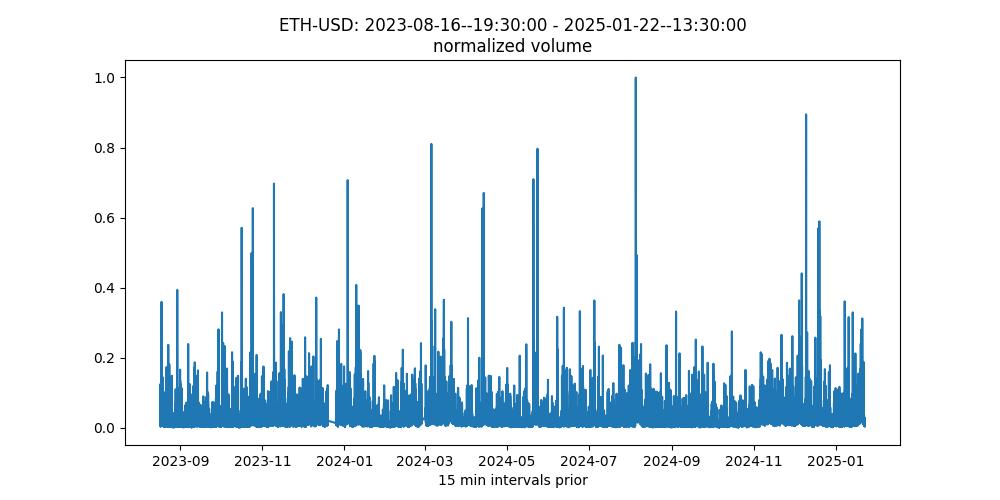
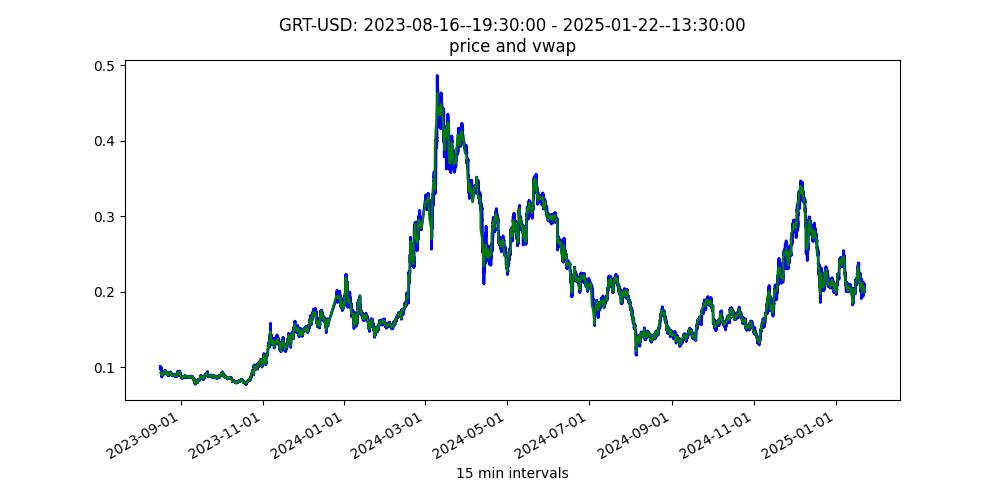
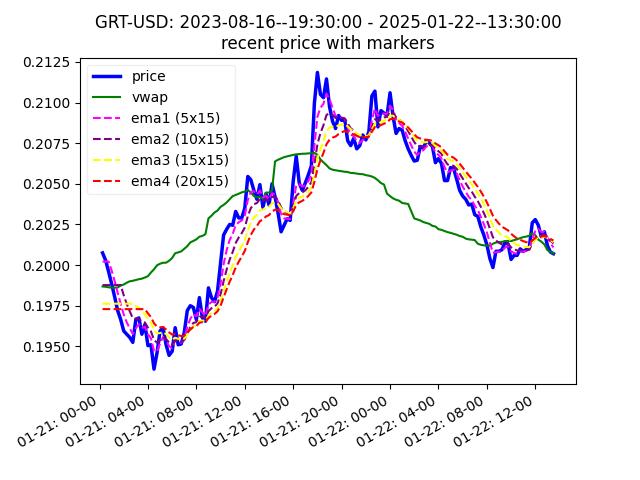
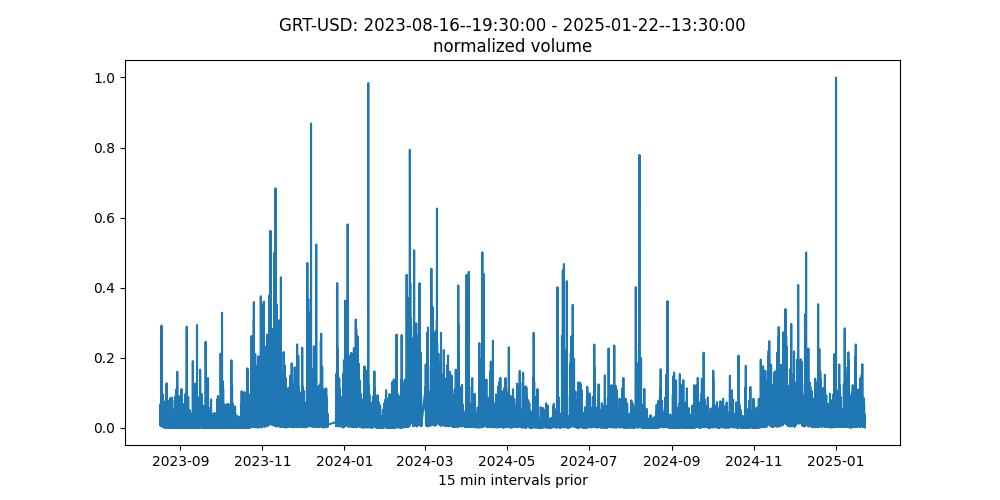
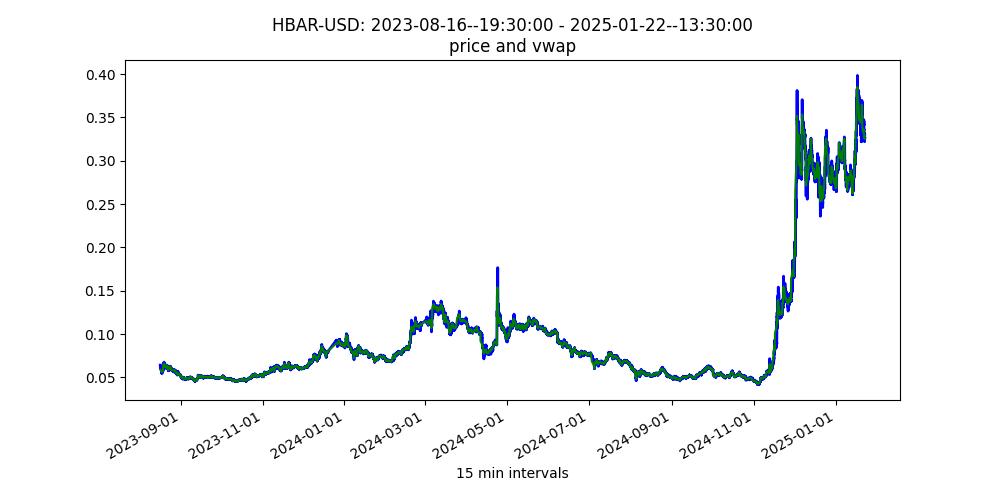
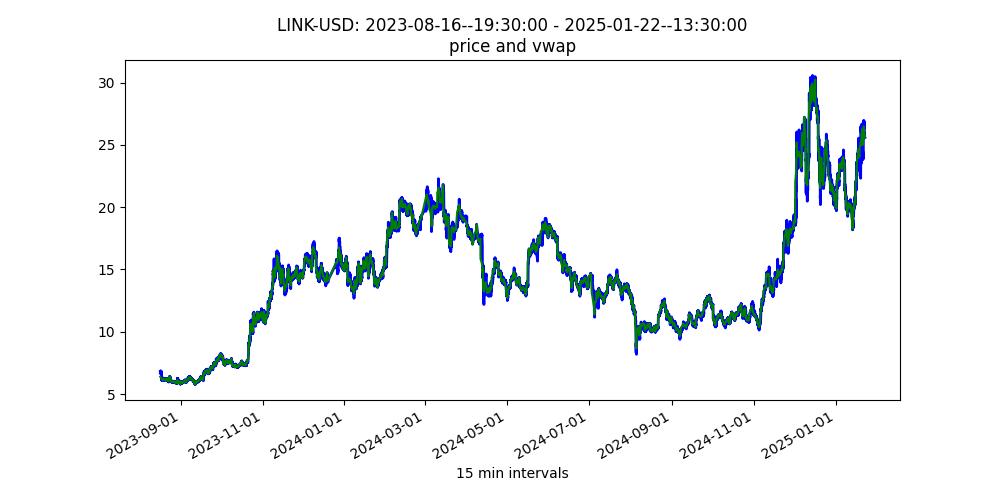
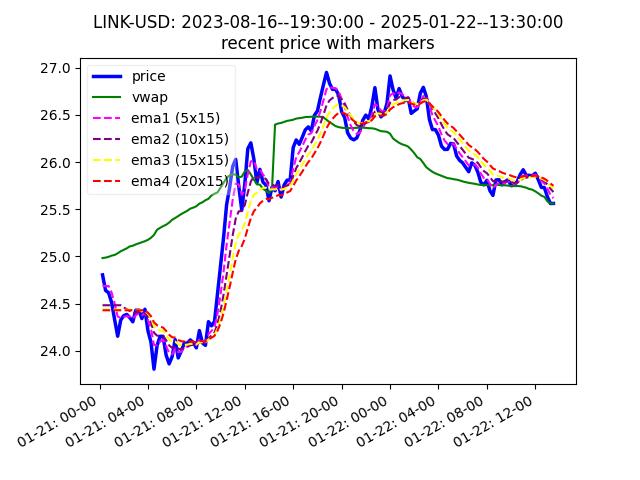
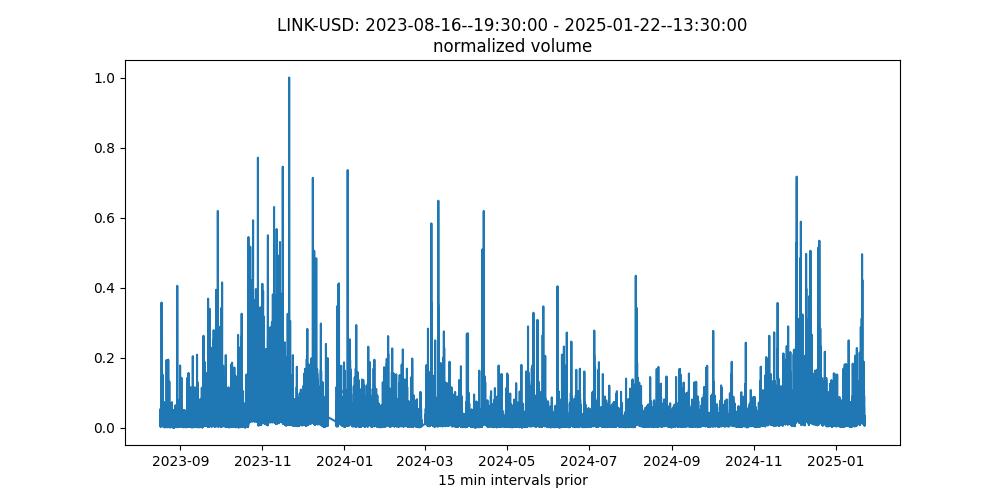
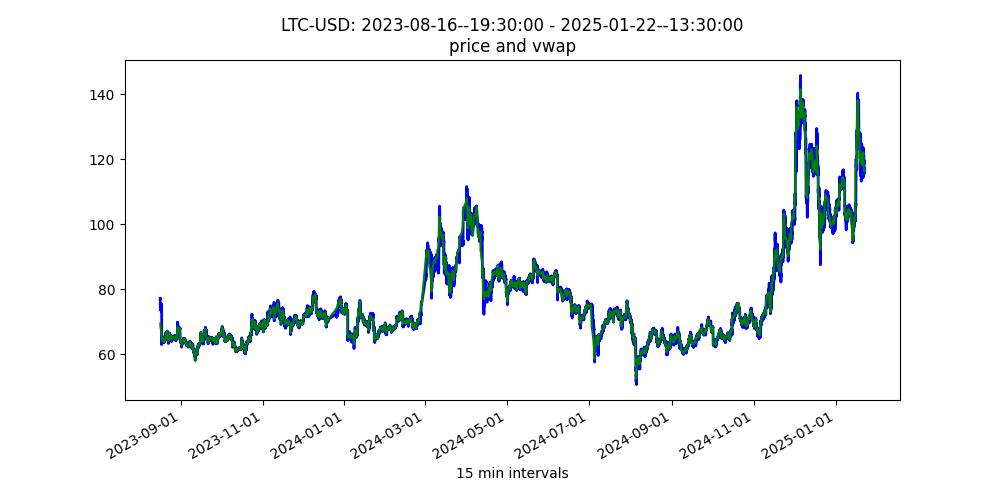
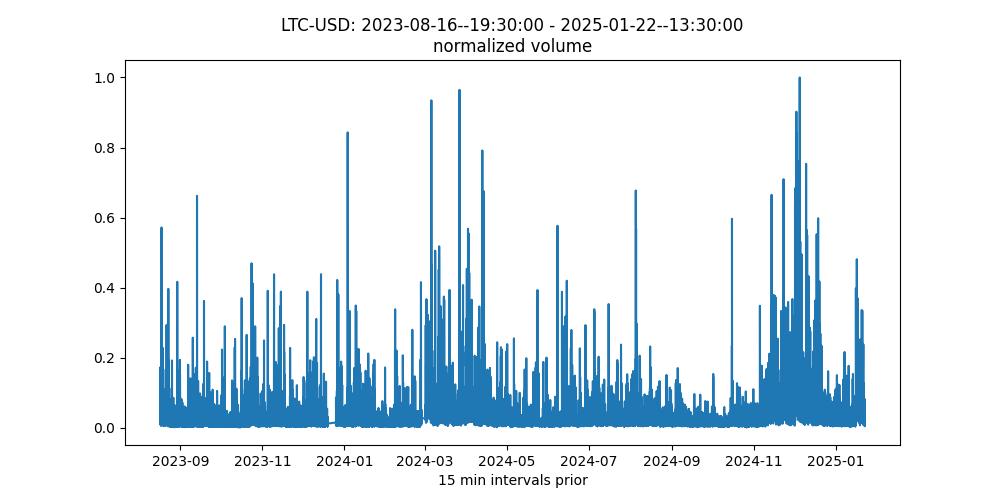
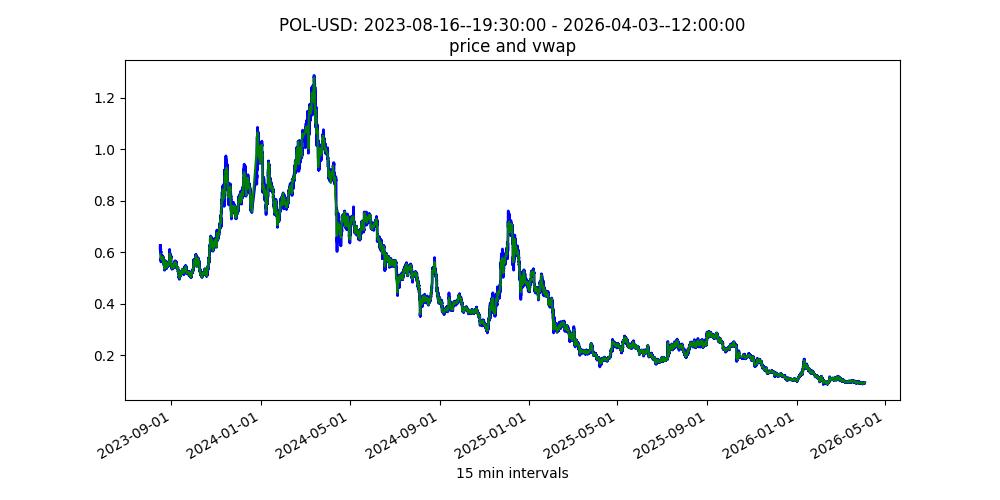
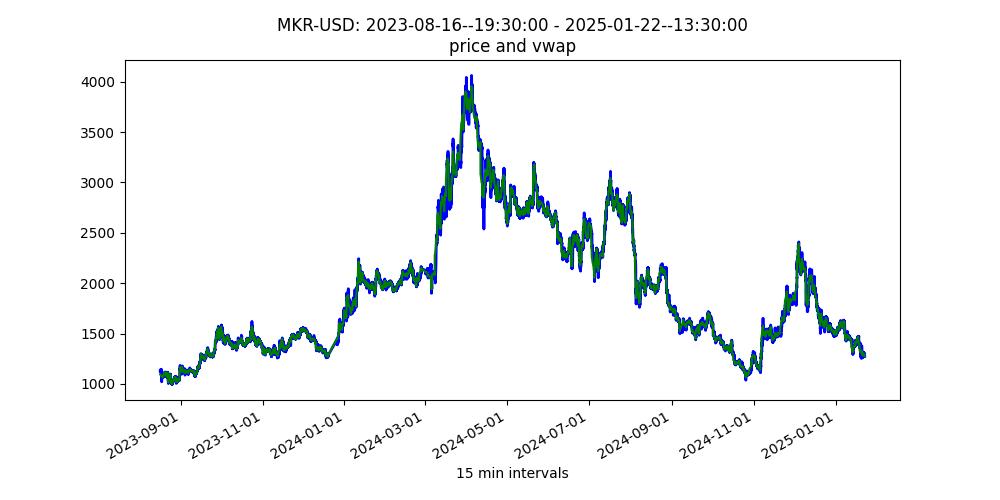
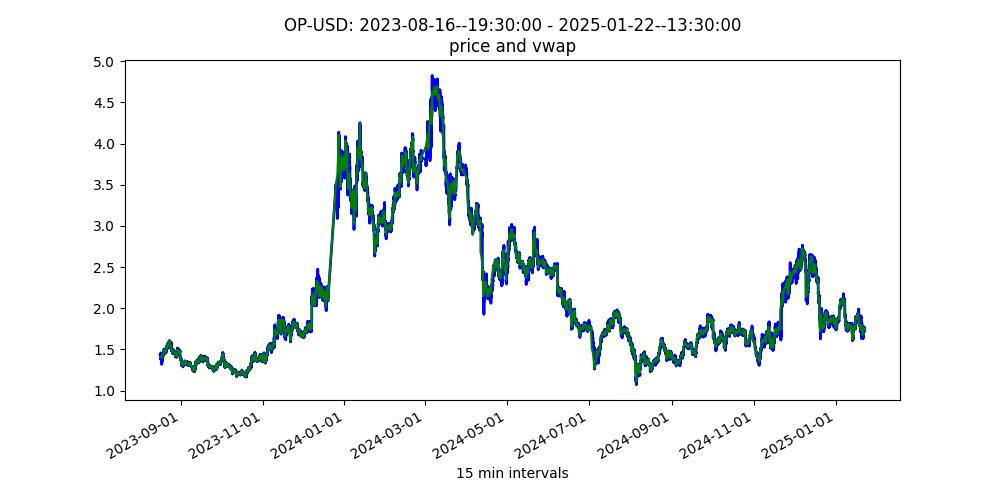
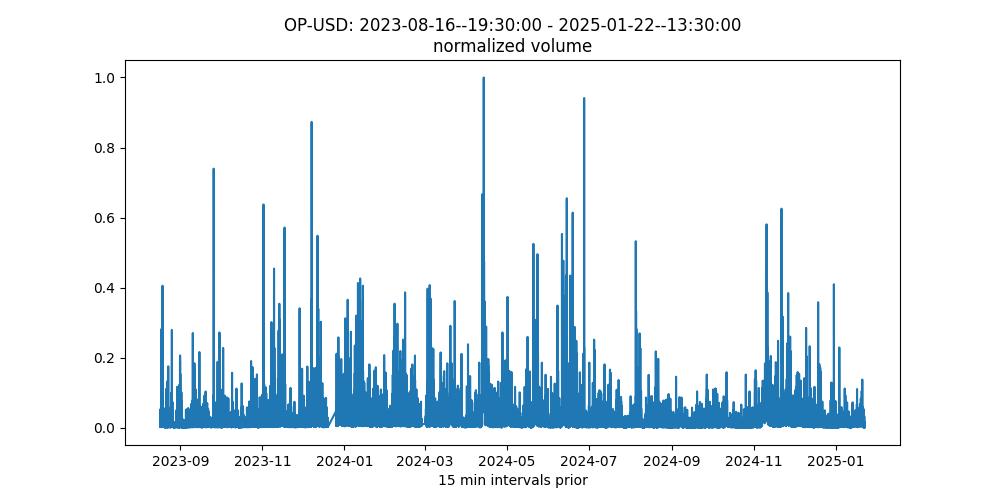
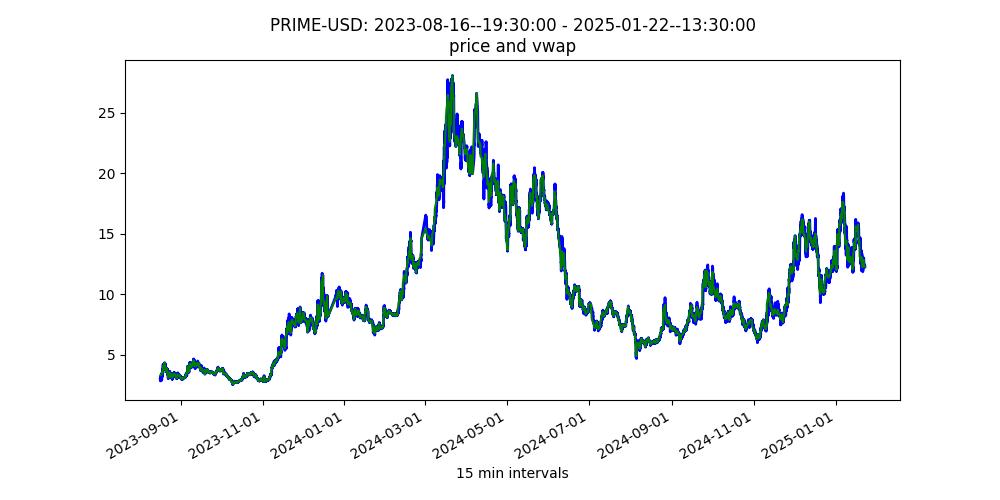
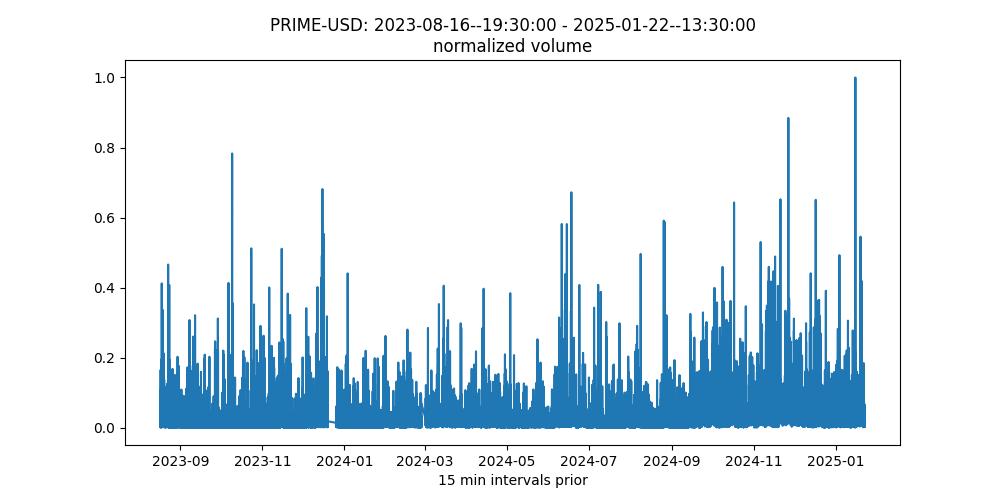
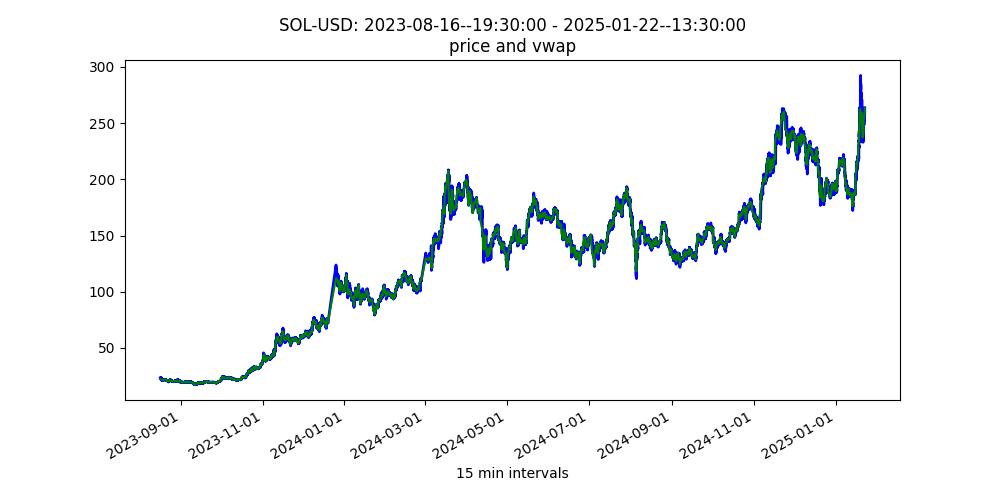
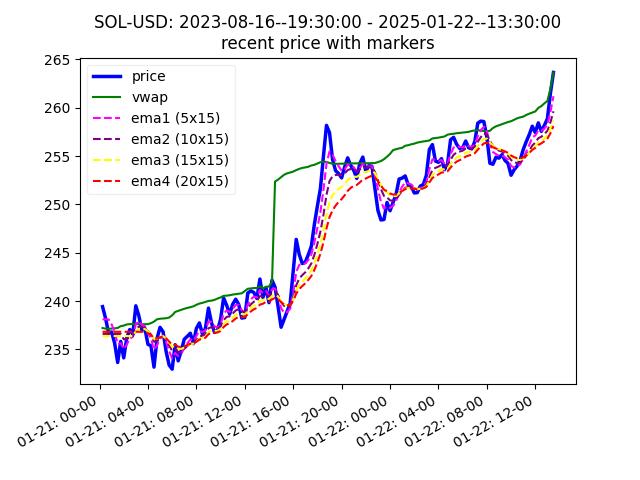
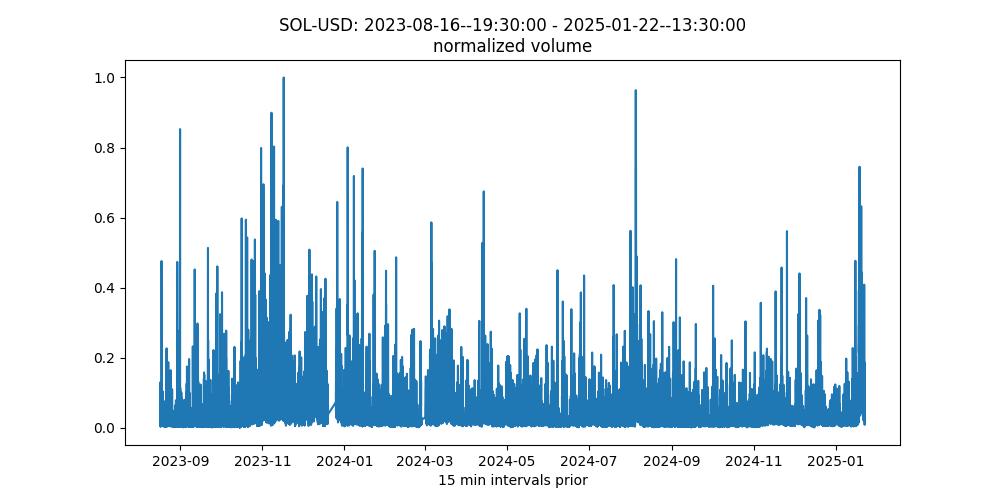
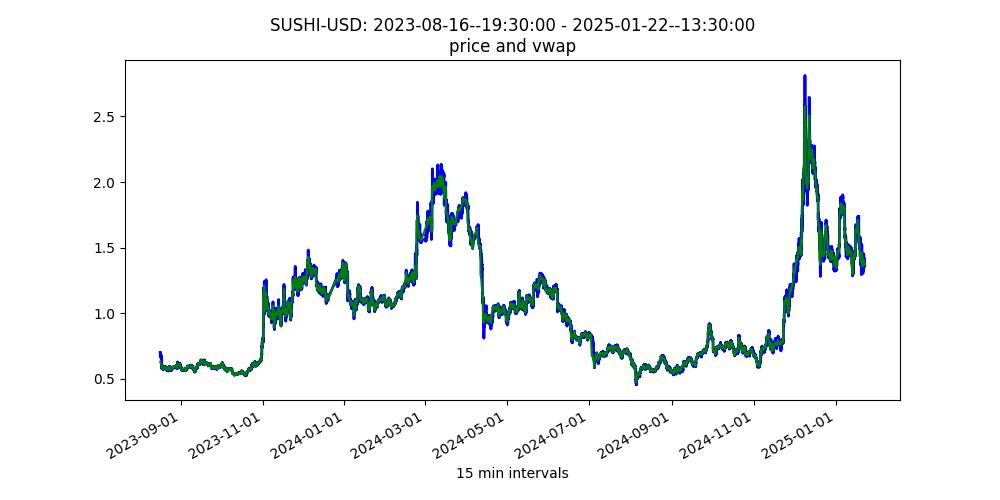
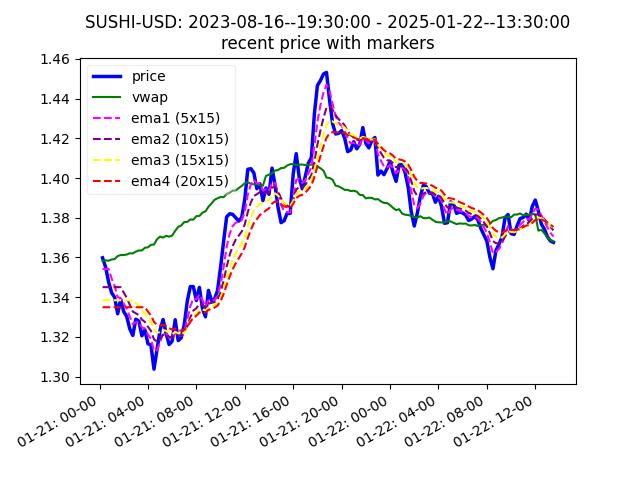
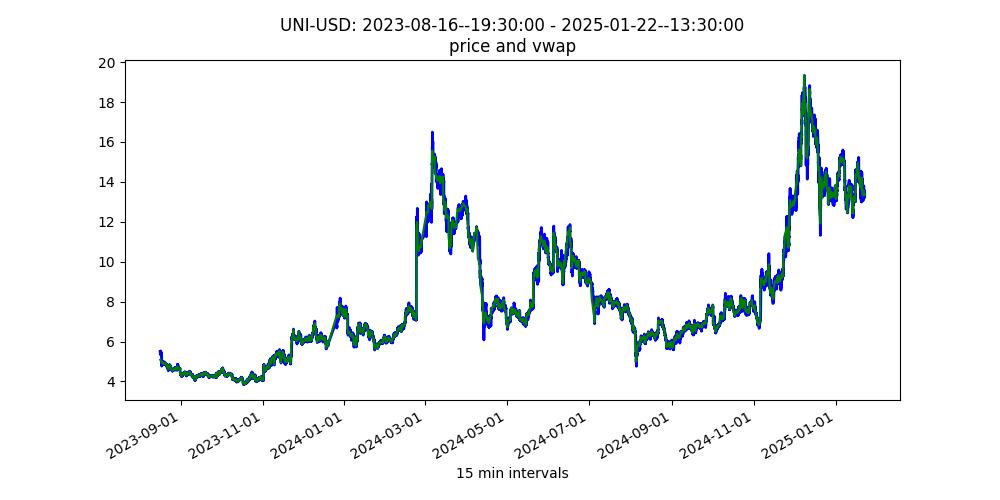
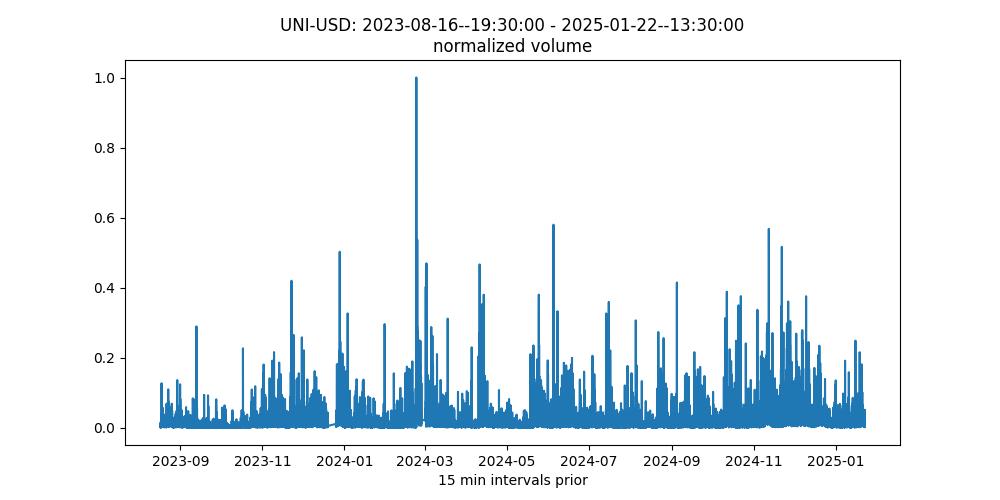
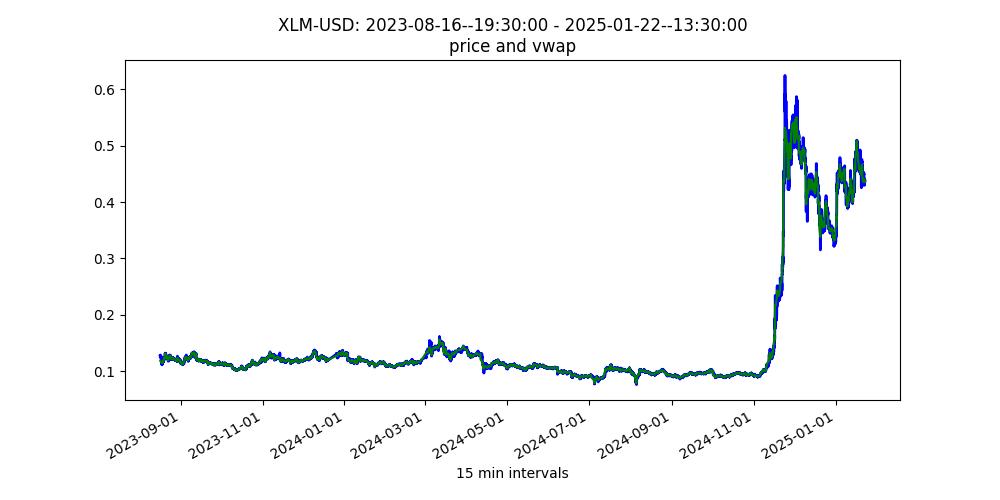
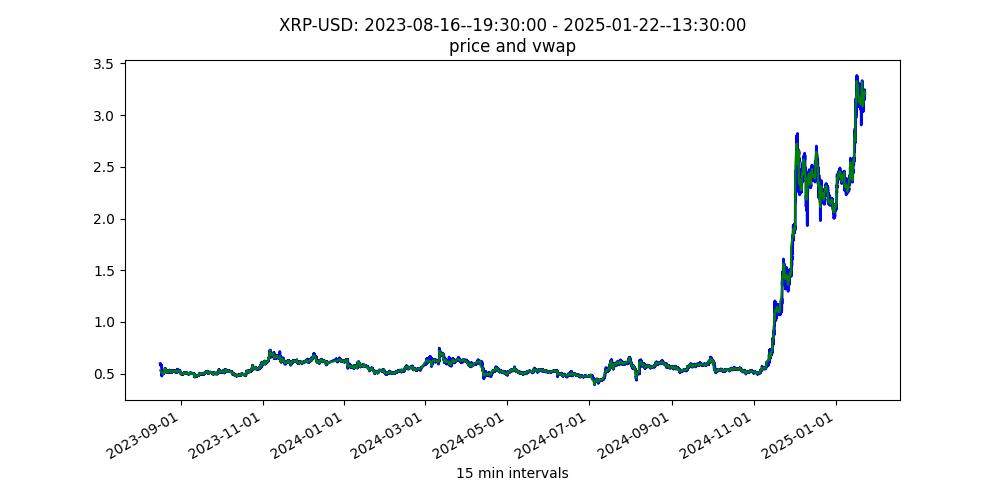
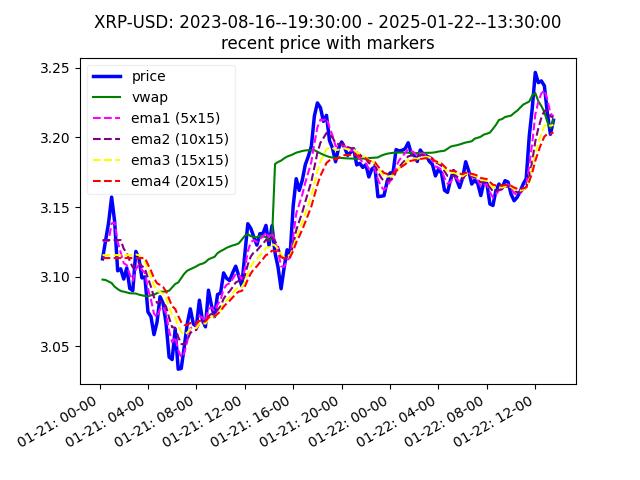
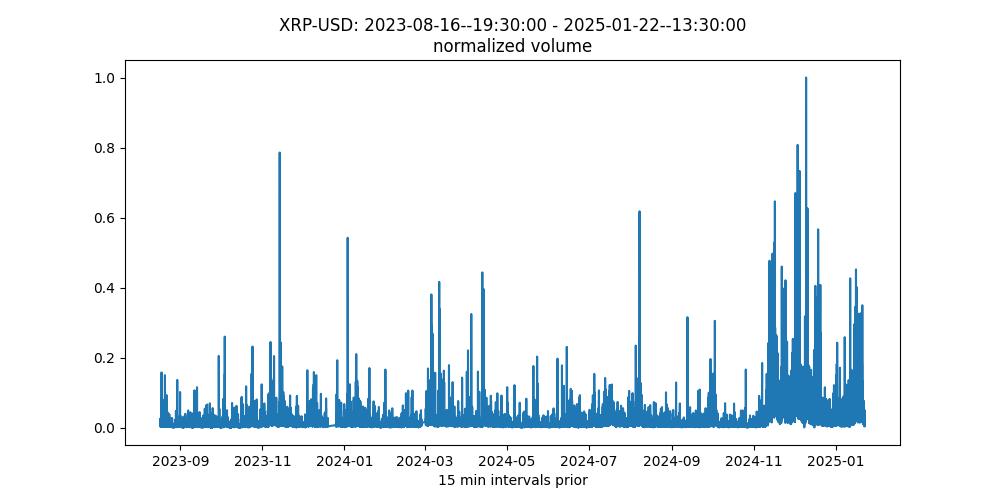
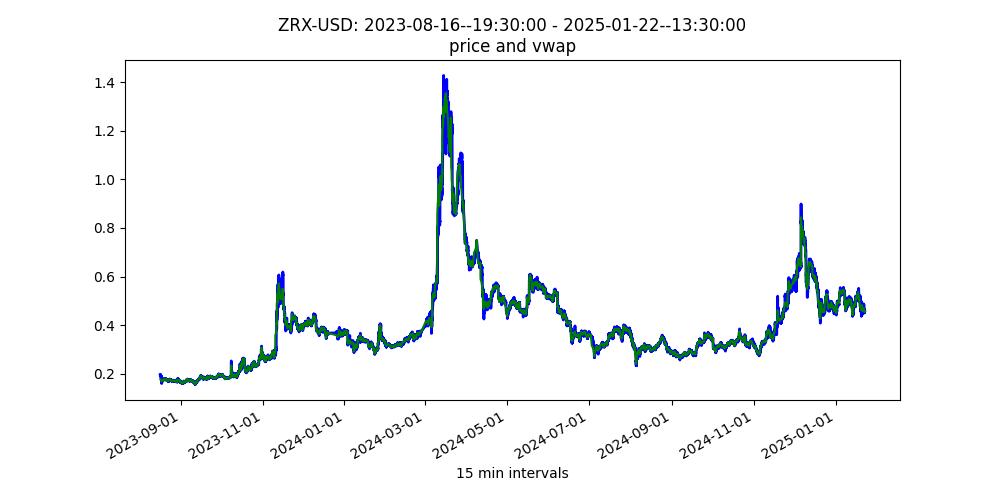
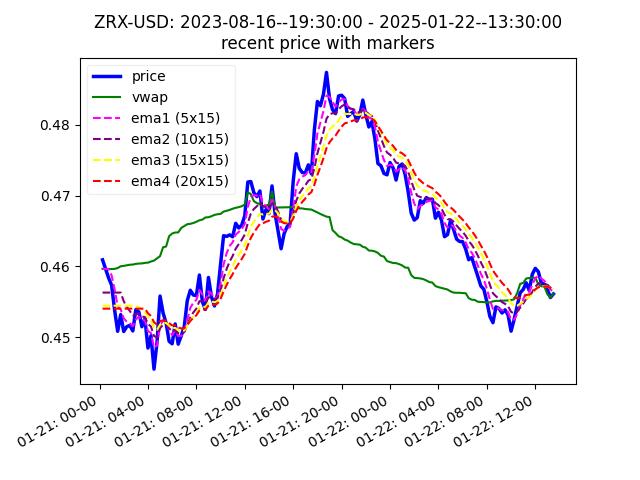
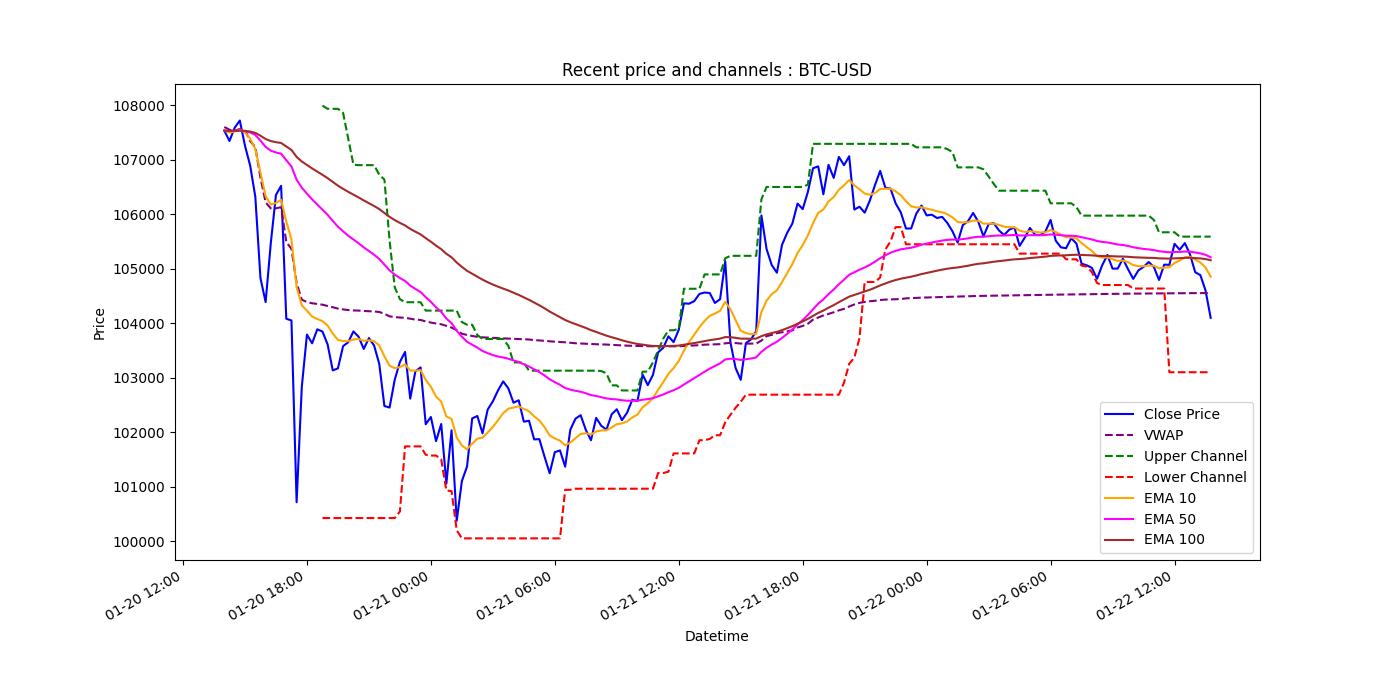
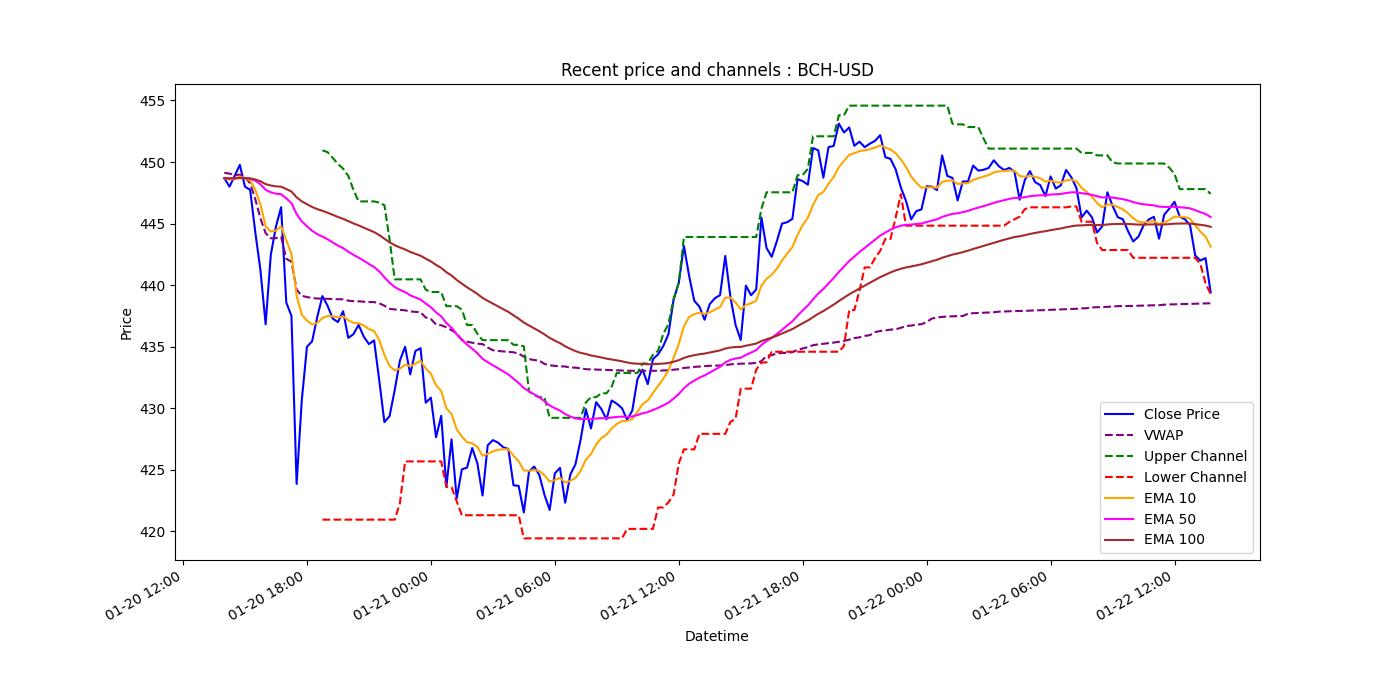
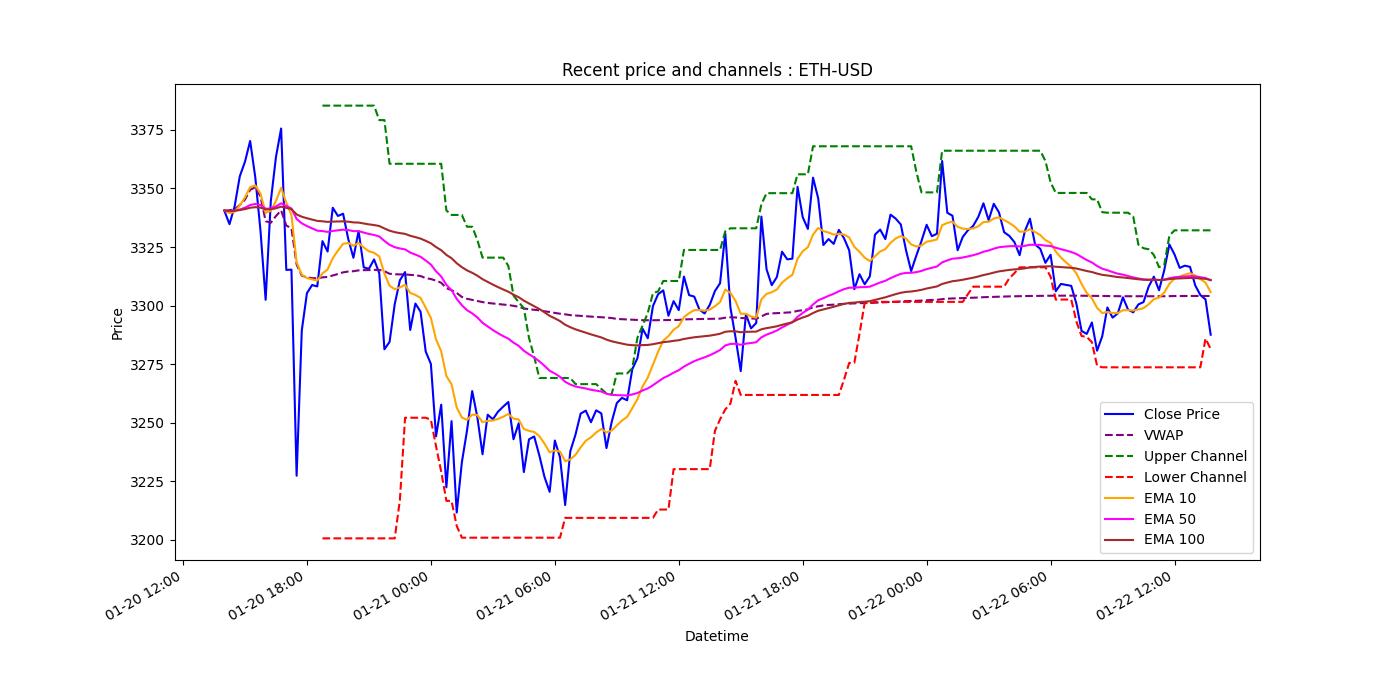
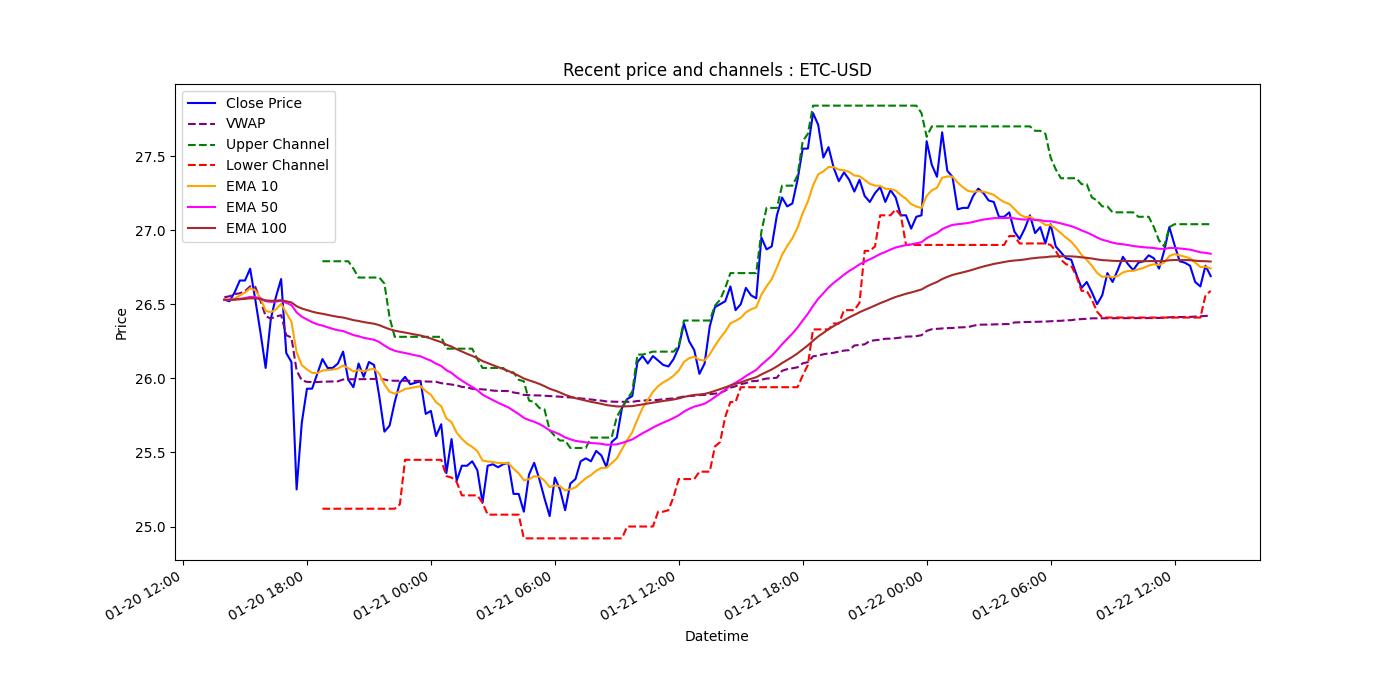
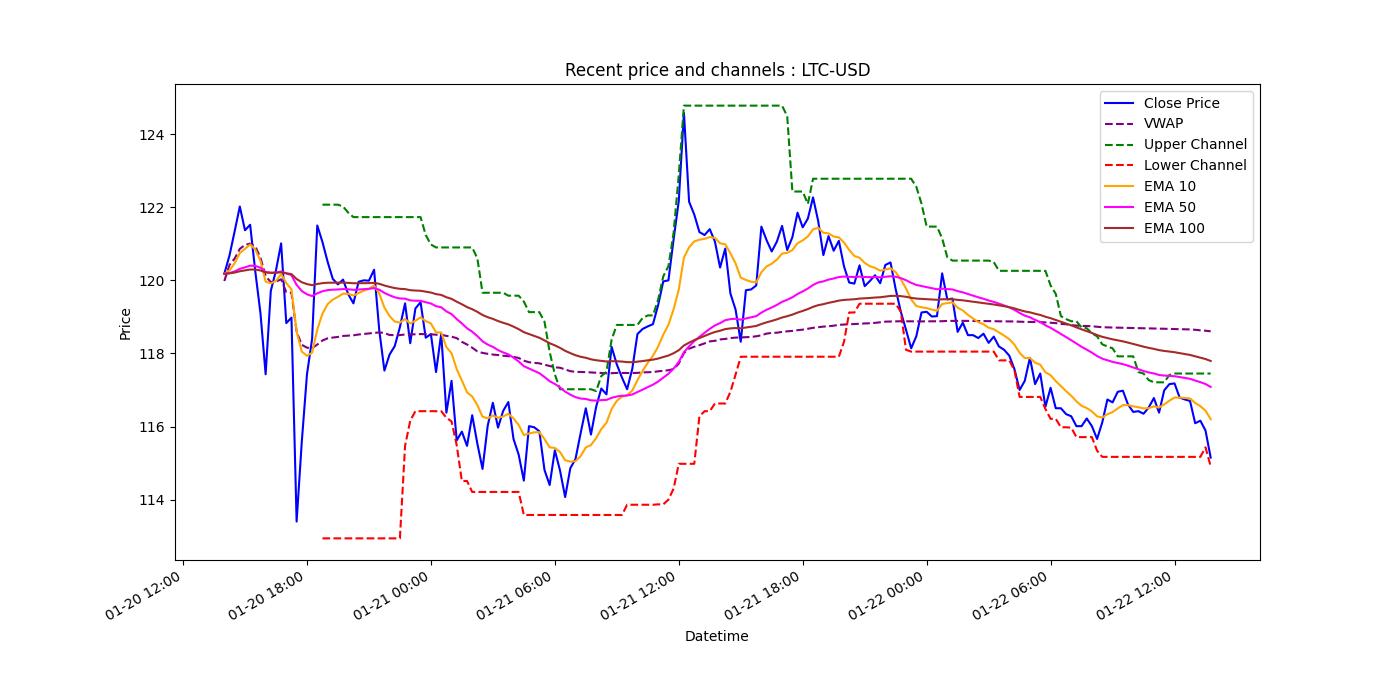
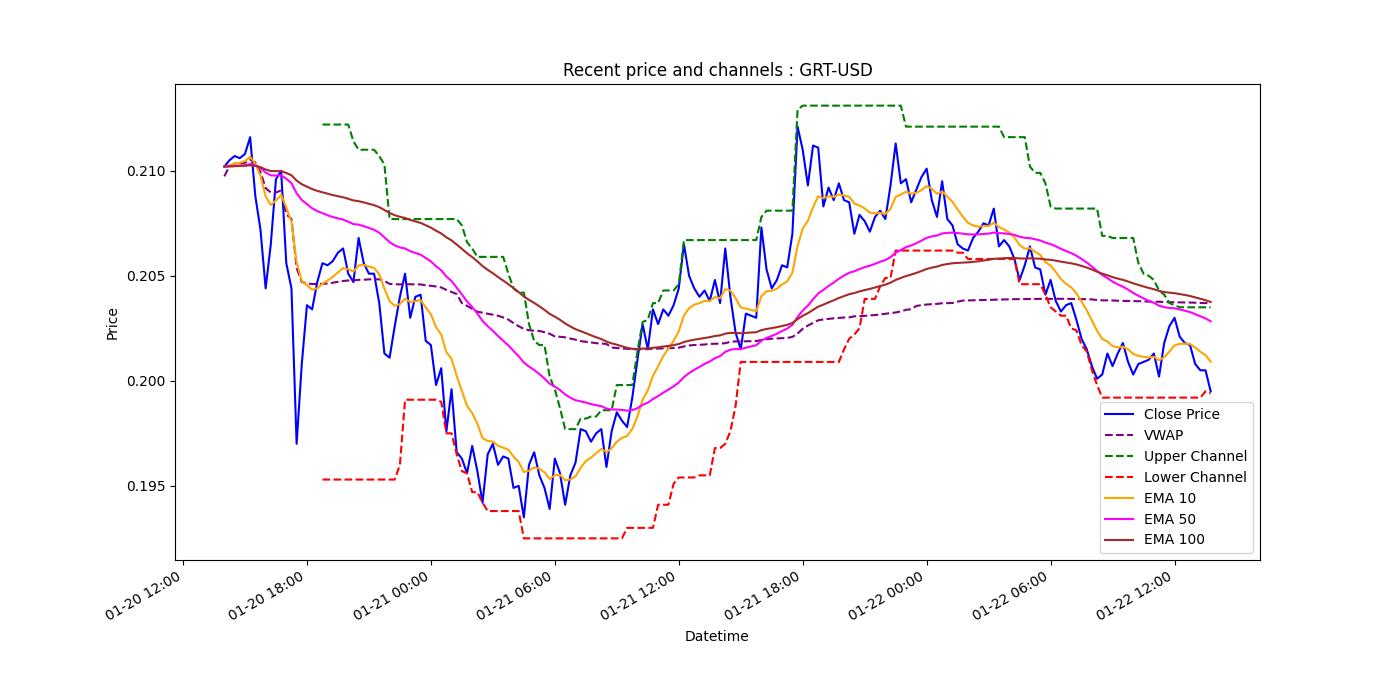
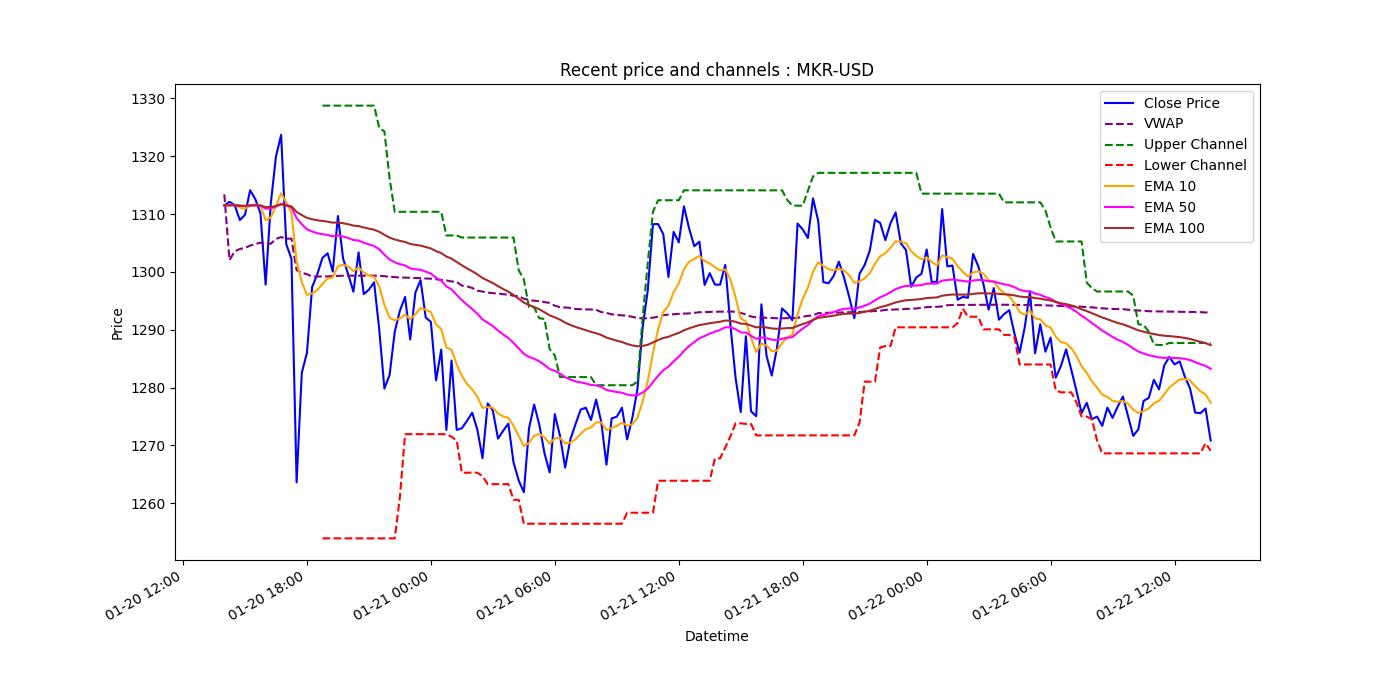
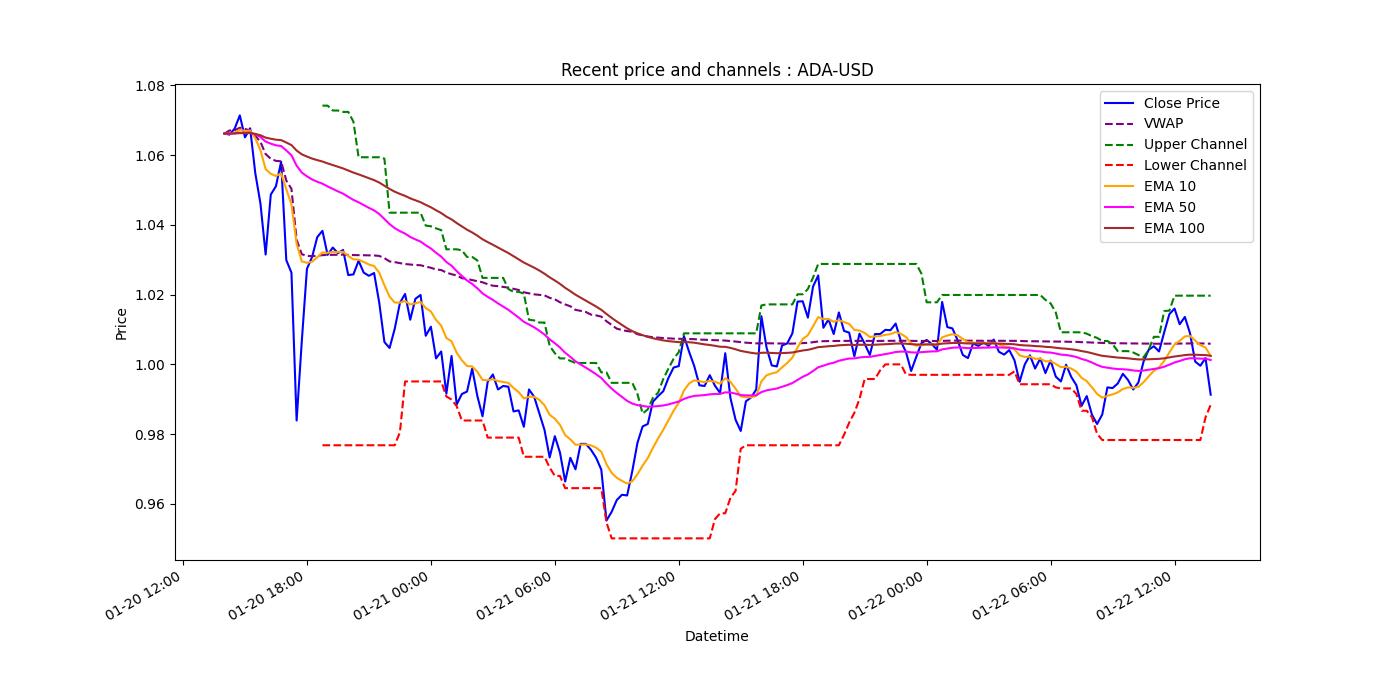
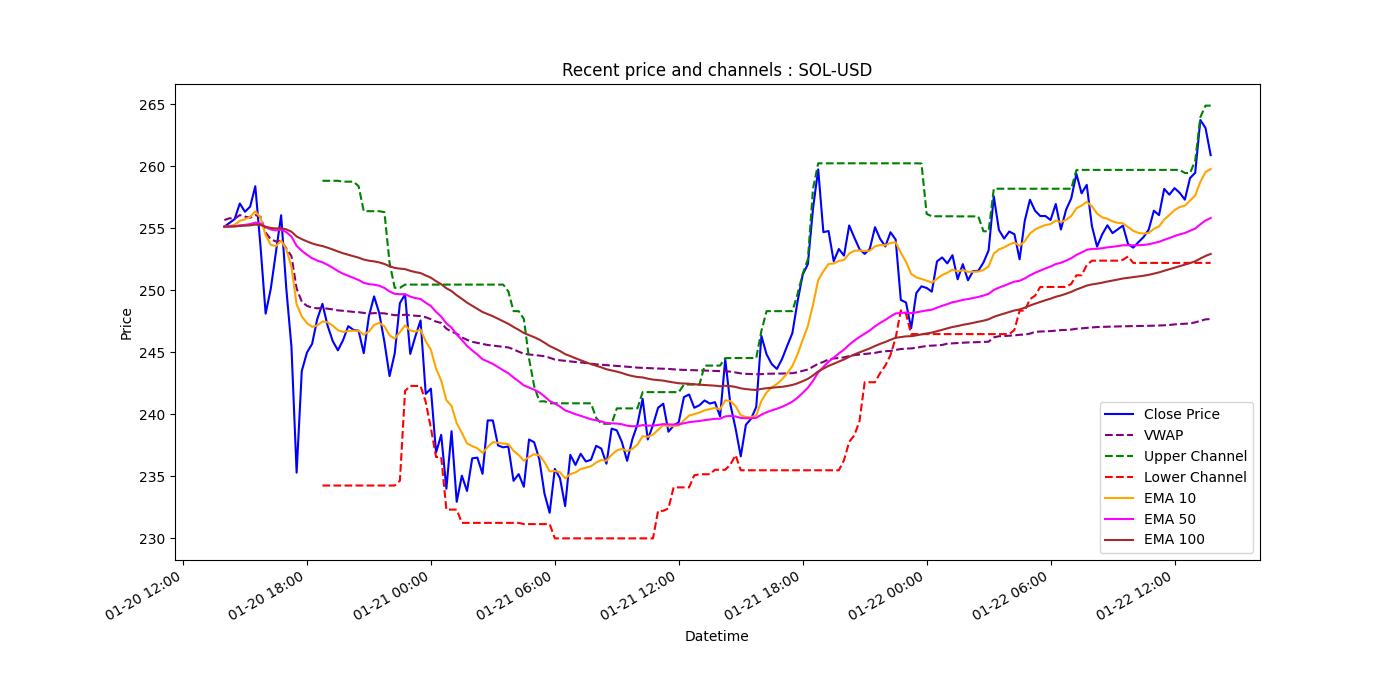
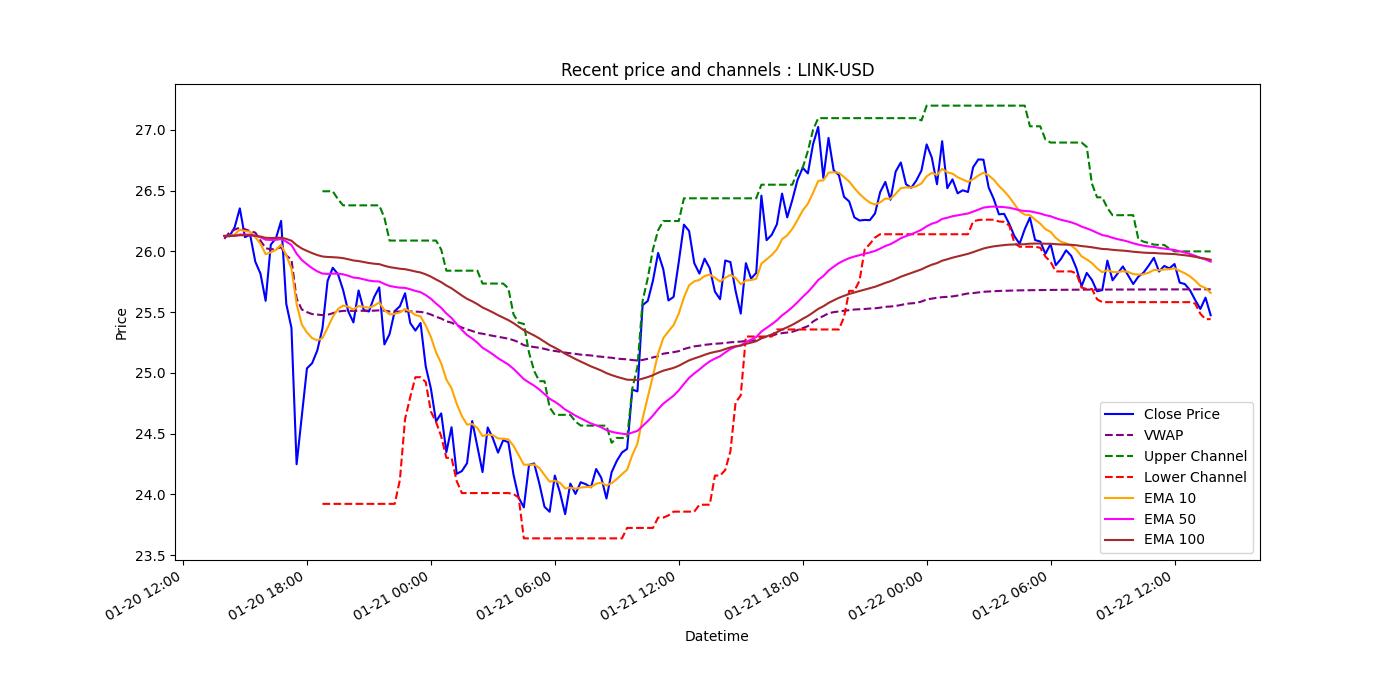
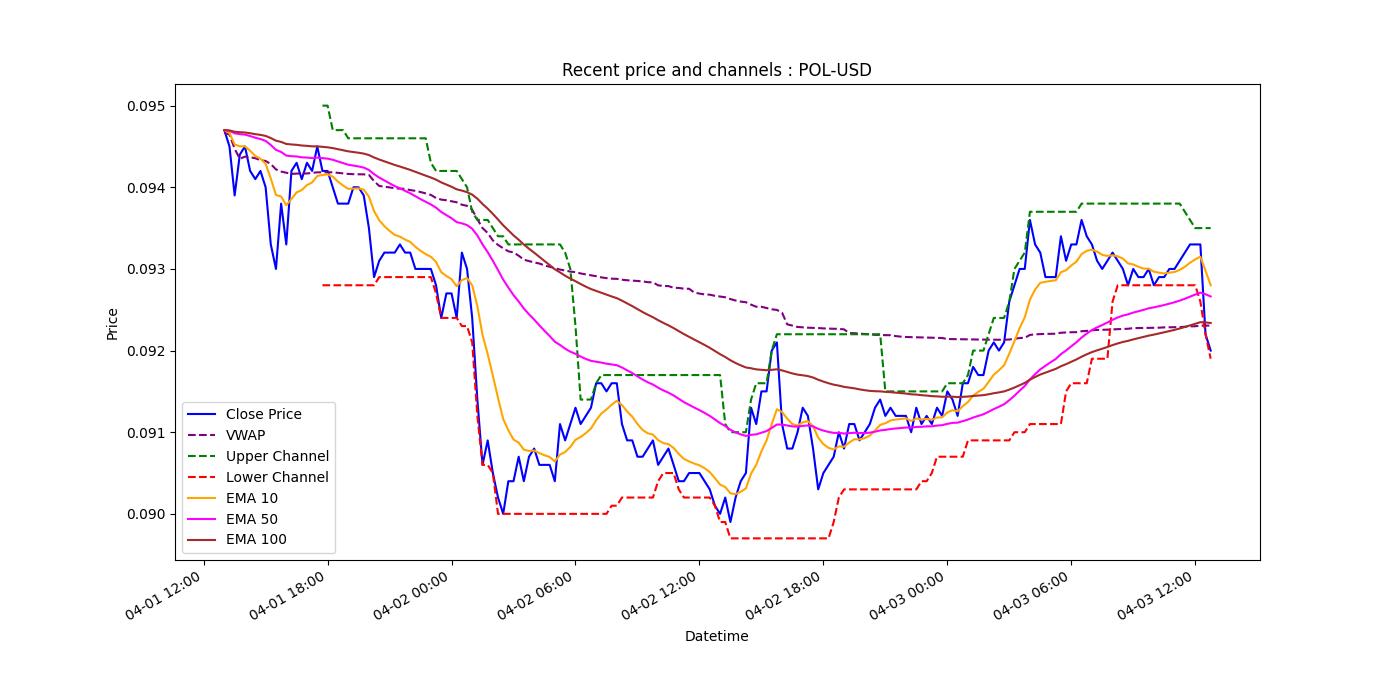
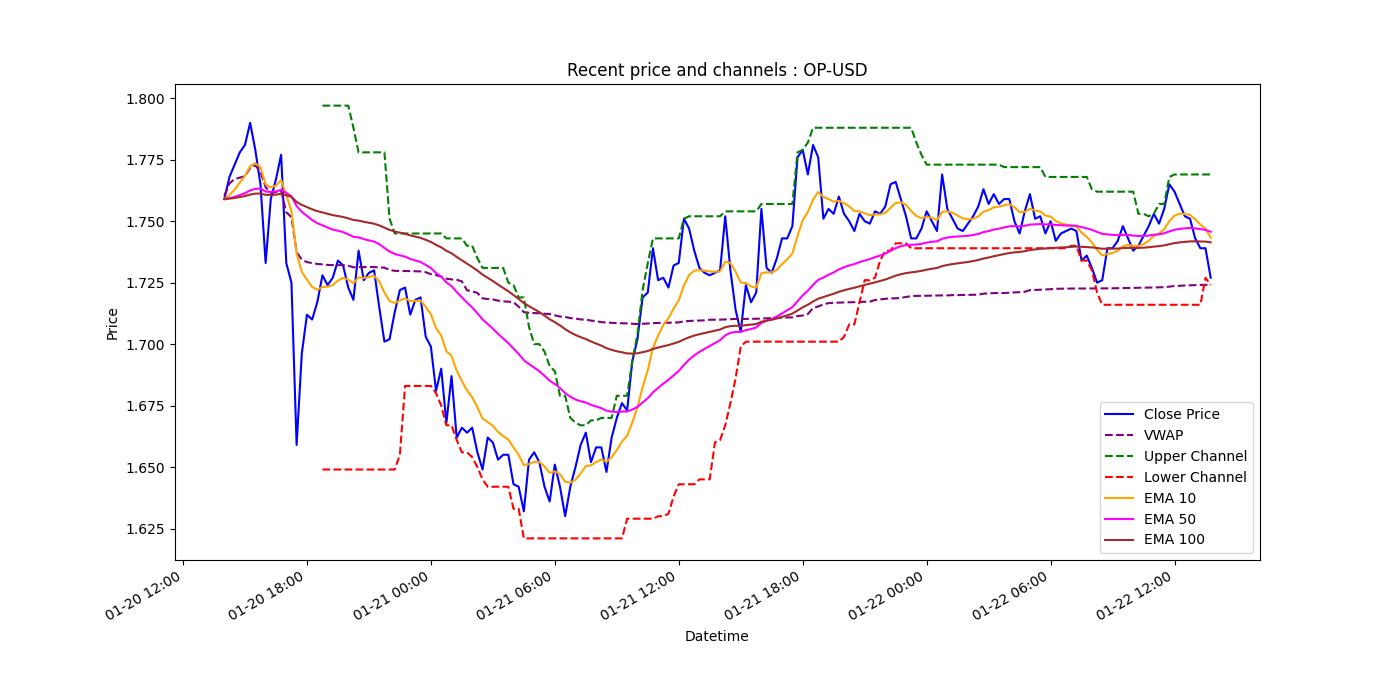
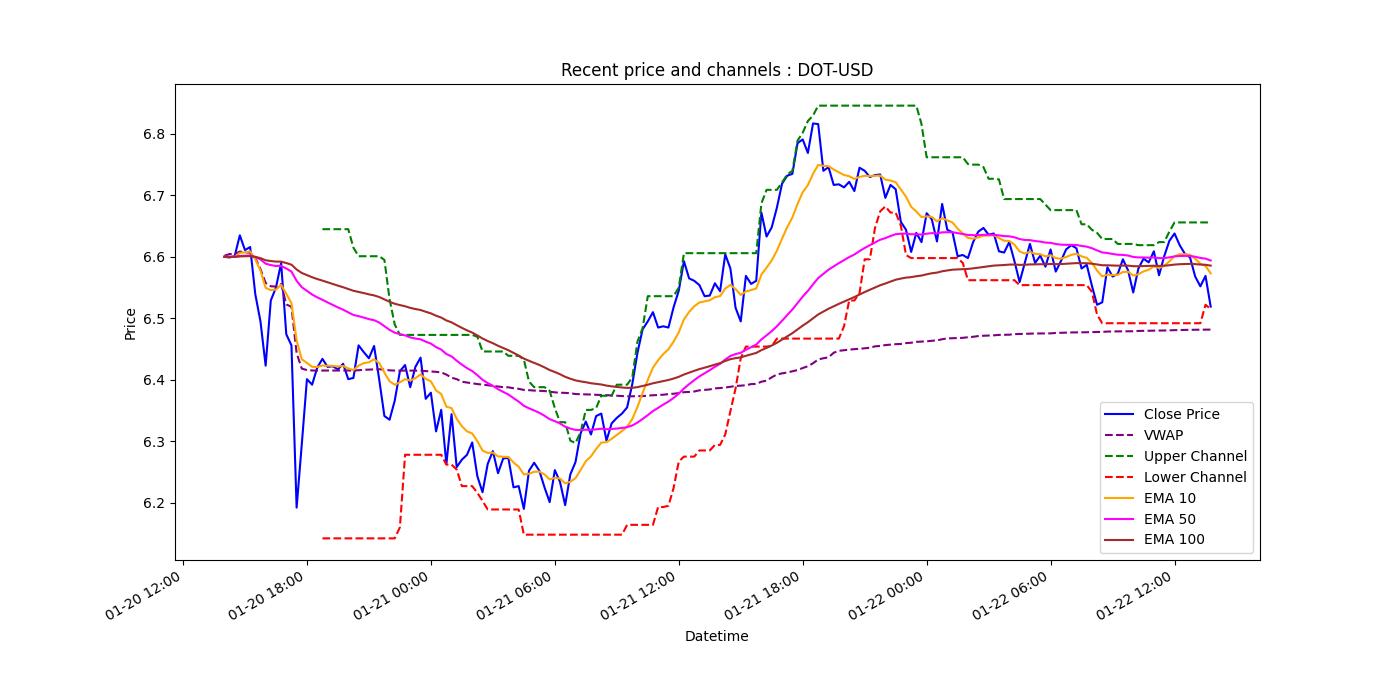
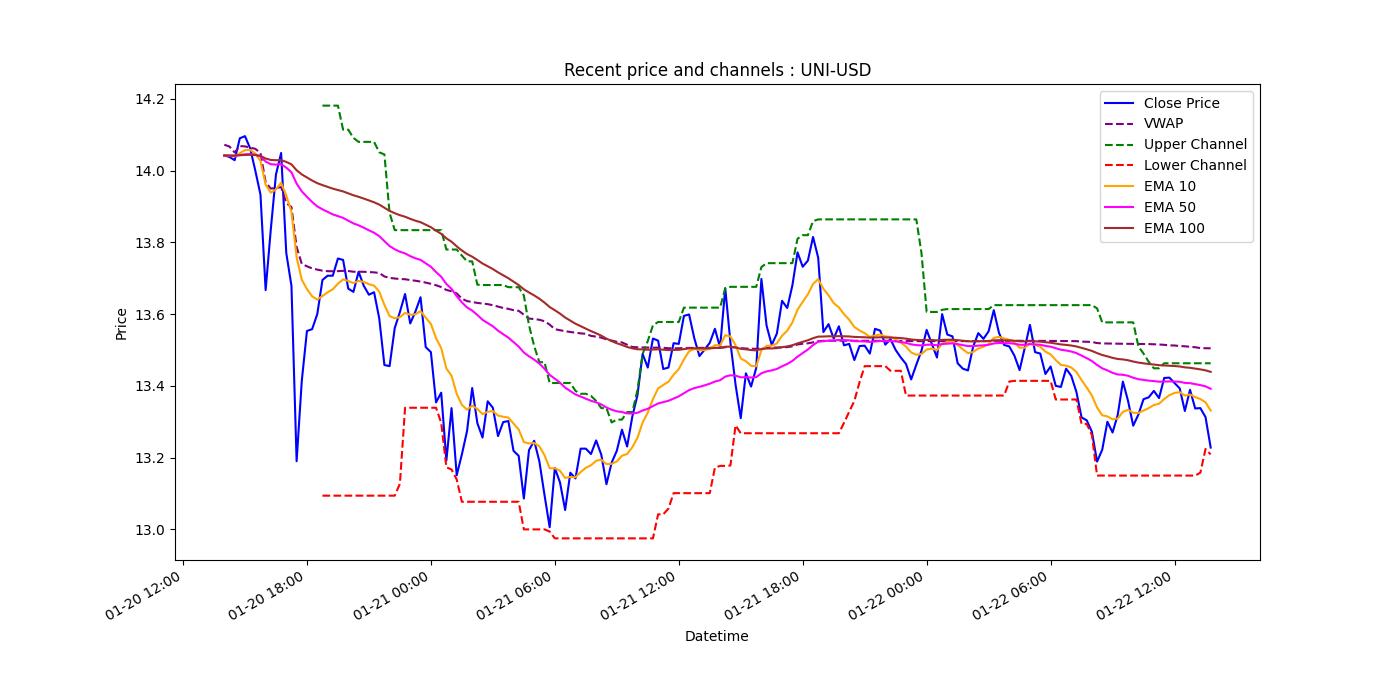
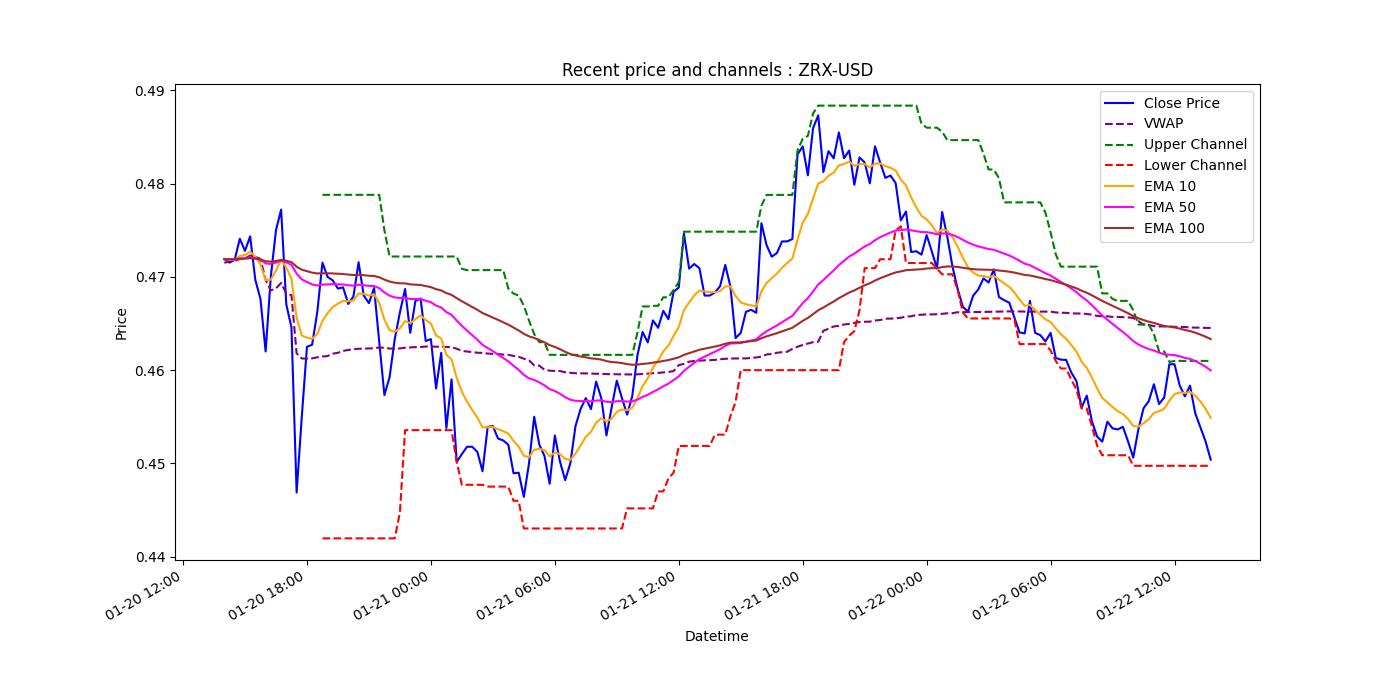
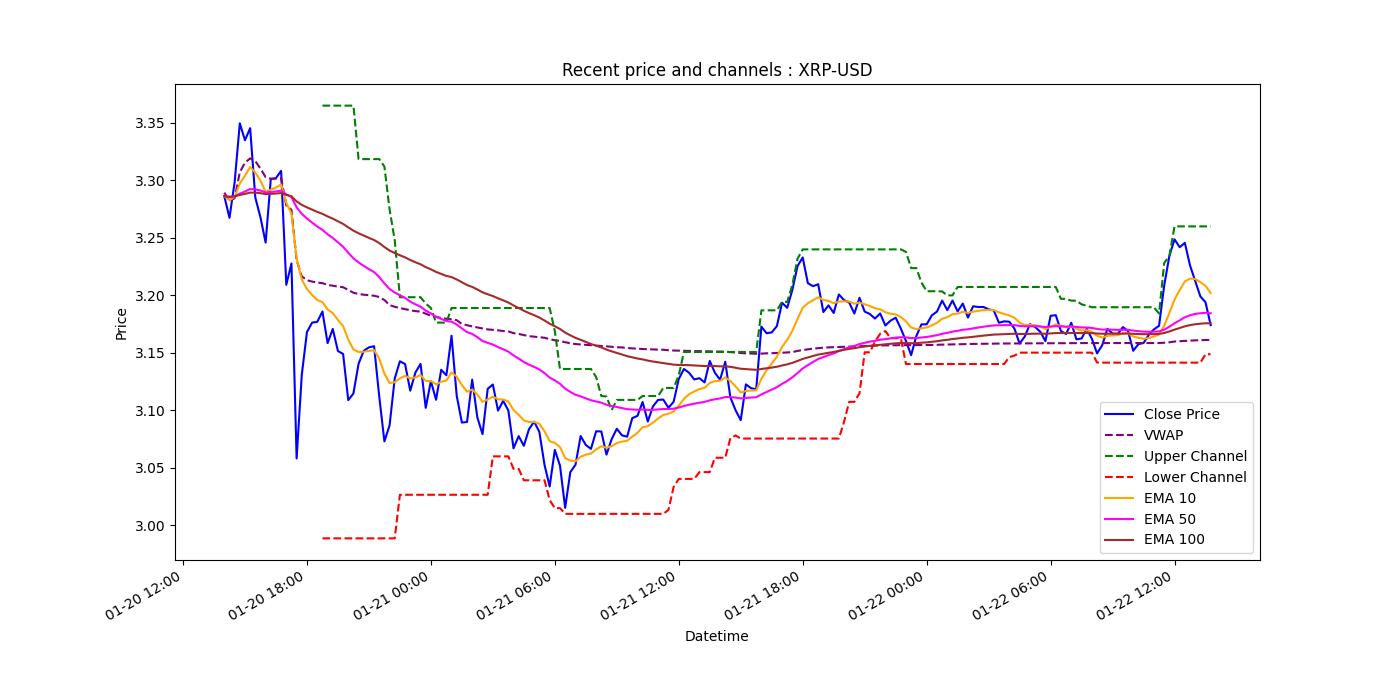
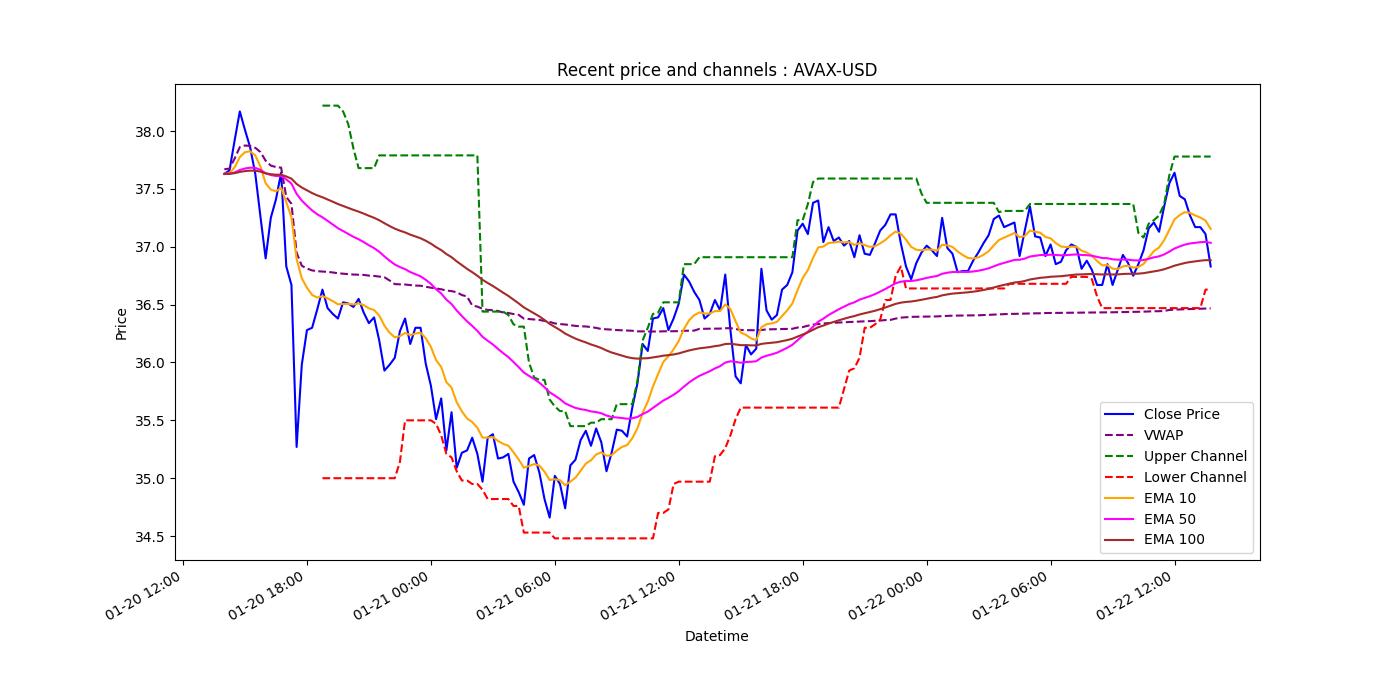
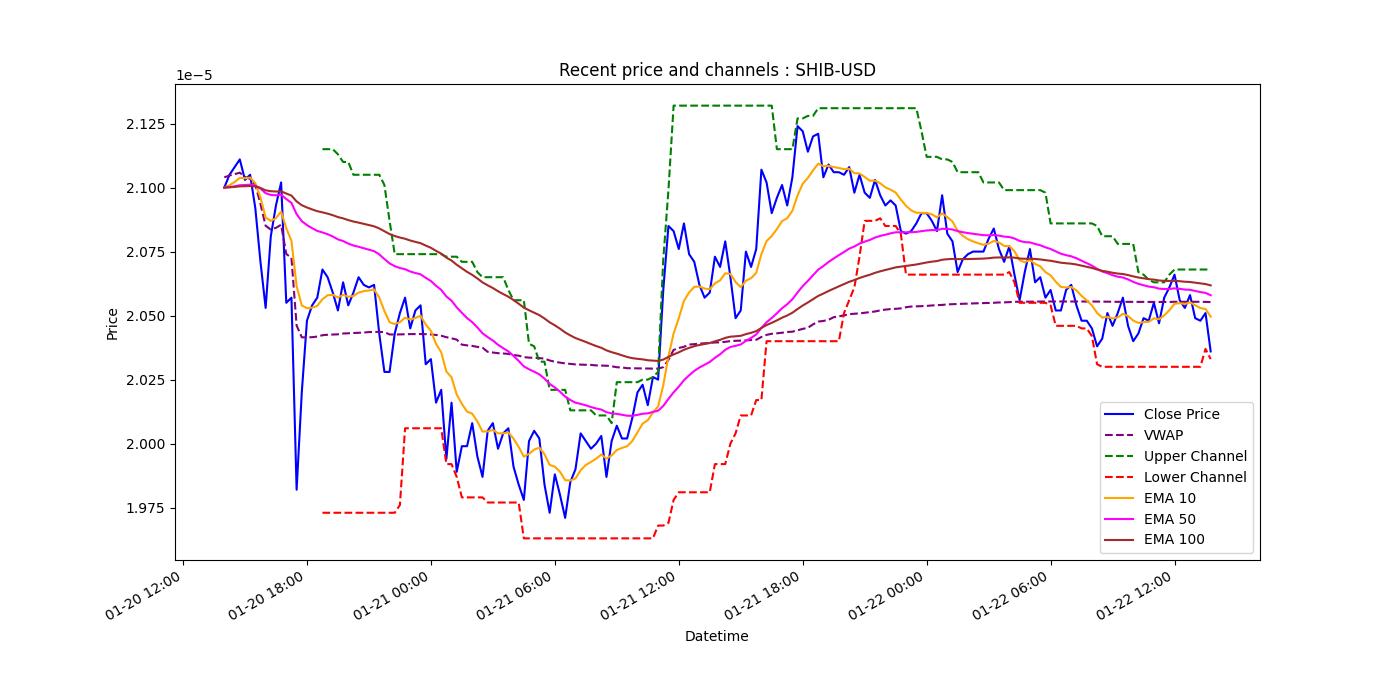
then look for assets where most model predictions agree in one direction (clear up or down). The normalized plots provide an indication to the near term percent change of a given asset (different assets may be predicted to go up in price, but the percent change could be very different). The longer term ("historical") price and volume weighted average price (vwap) plots on the left indicate
the position of the current asset value relative to the last several weeks and can be used as an indicator of the potential
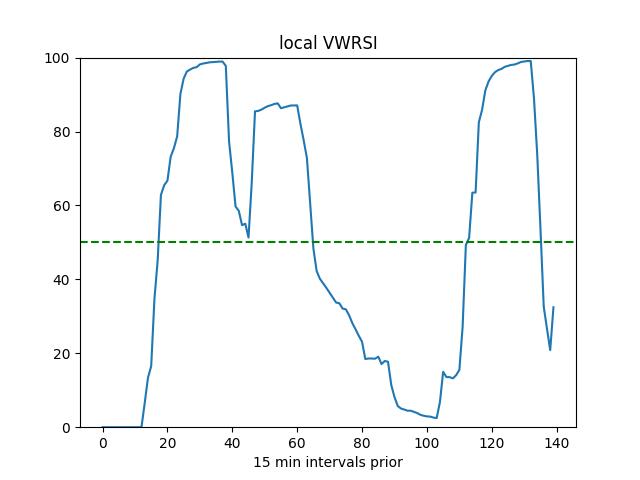
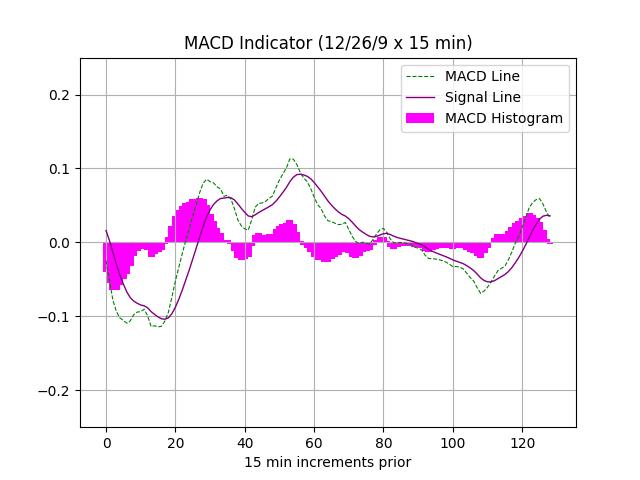
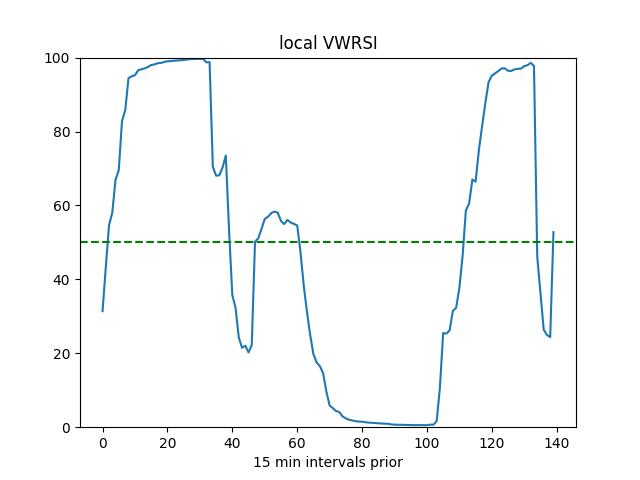
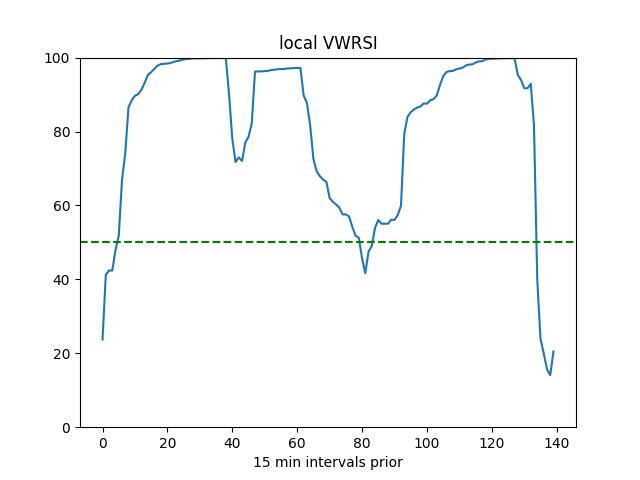
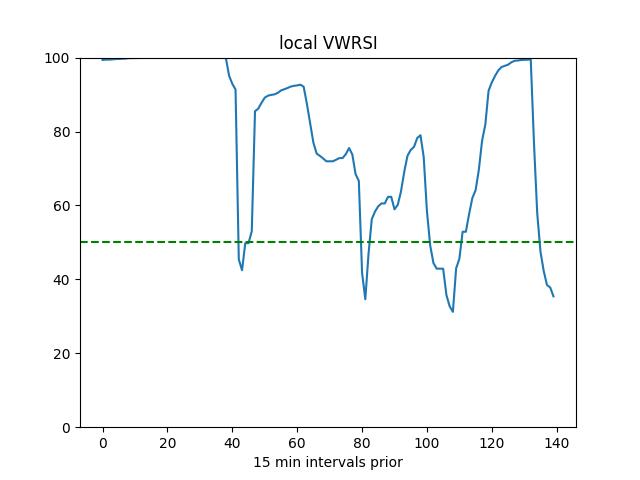
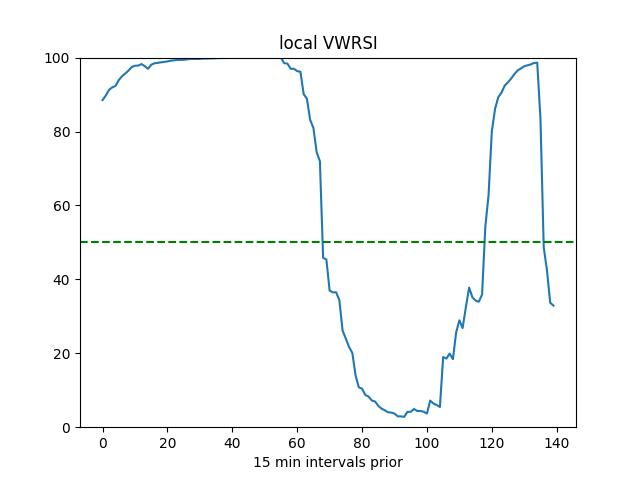
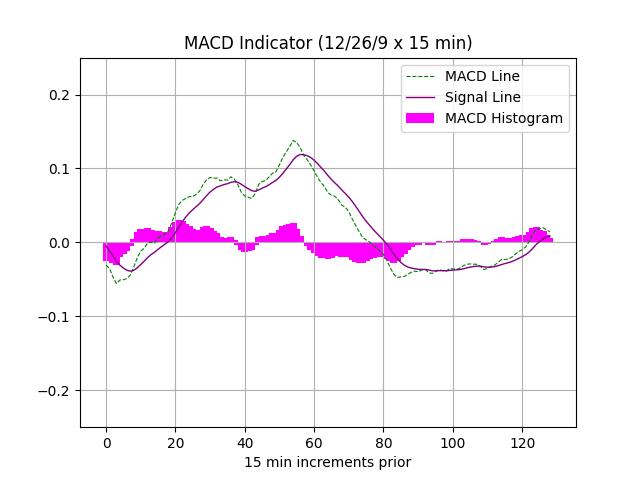
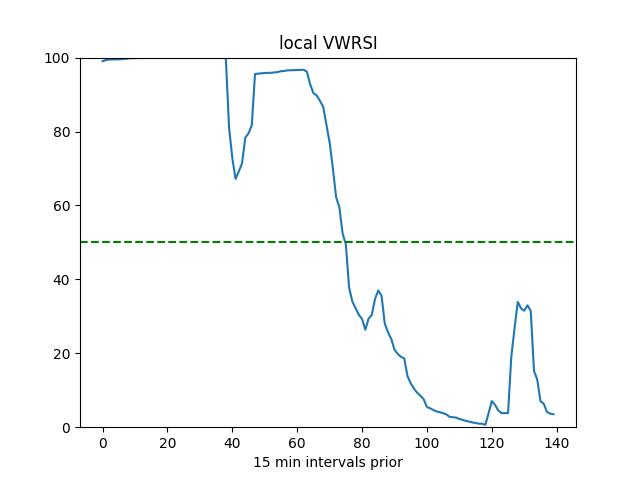
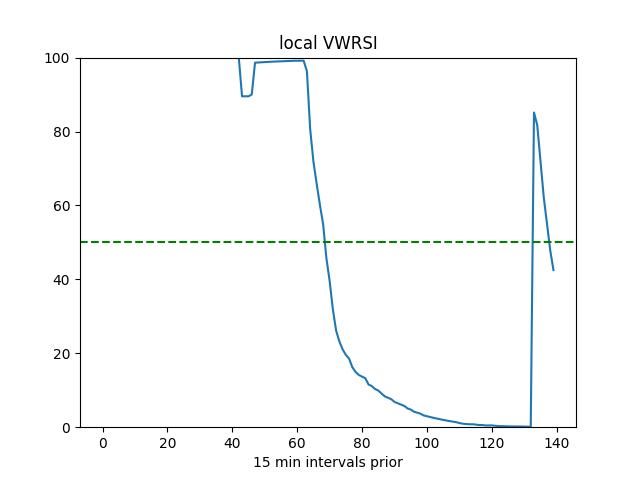
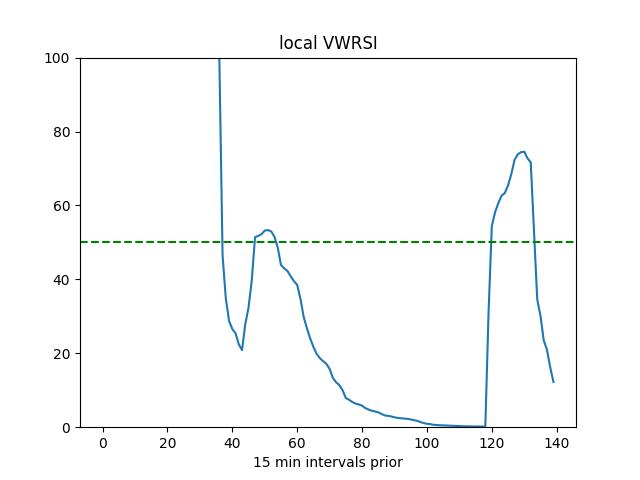
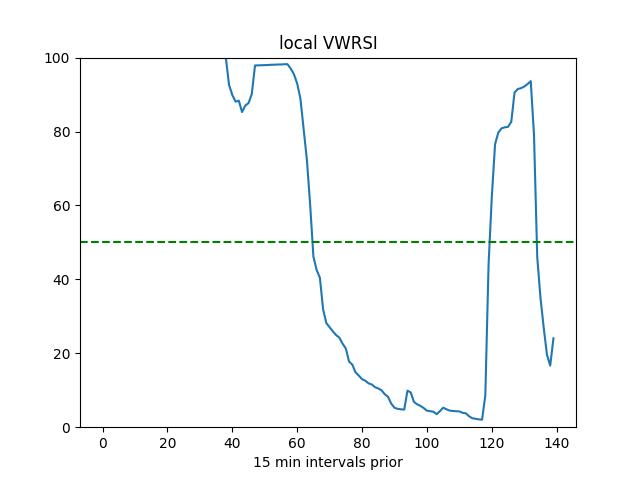
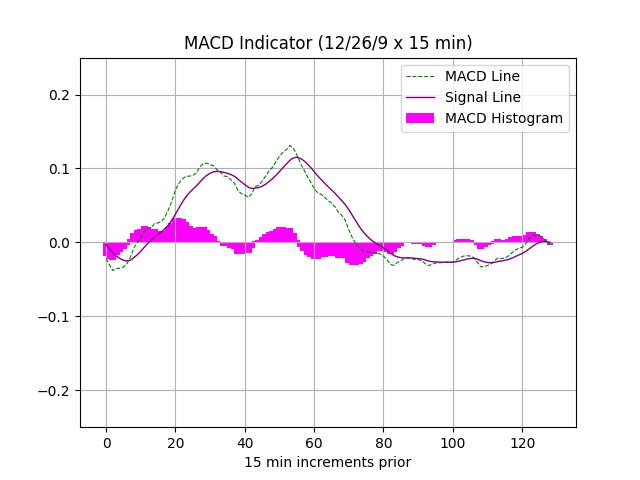
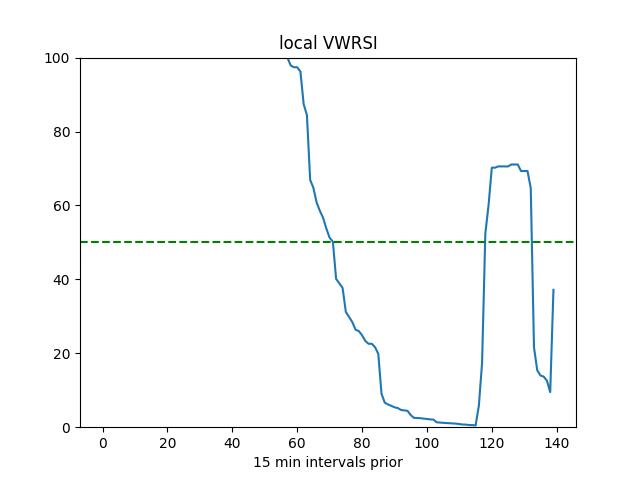
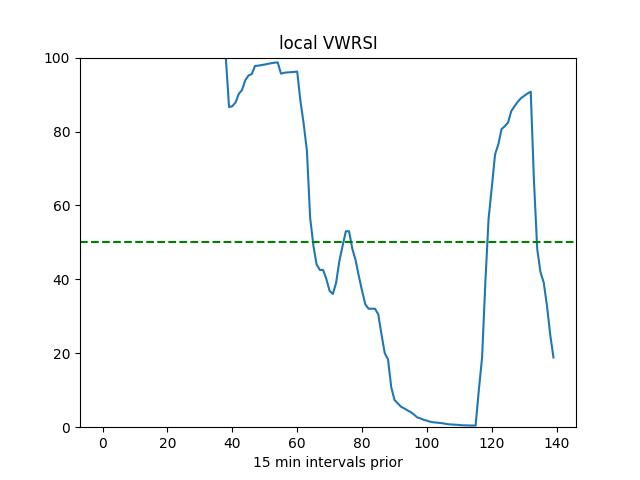
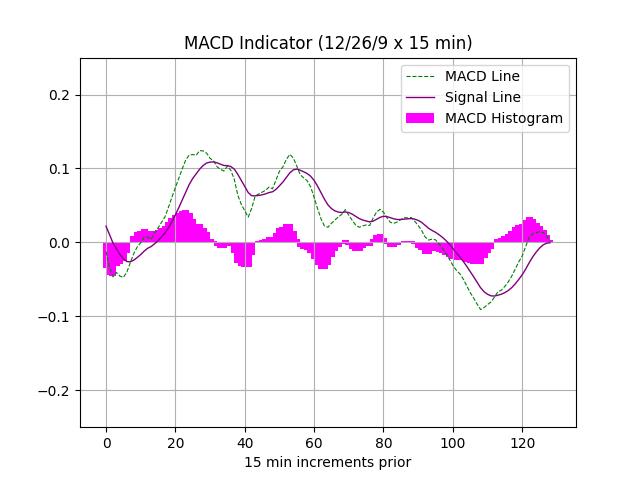
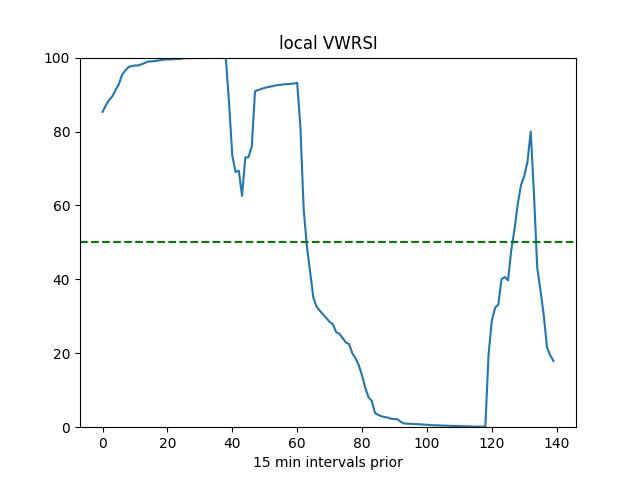
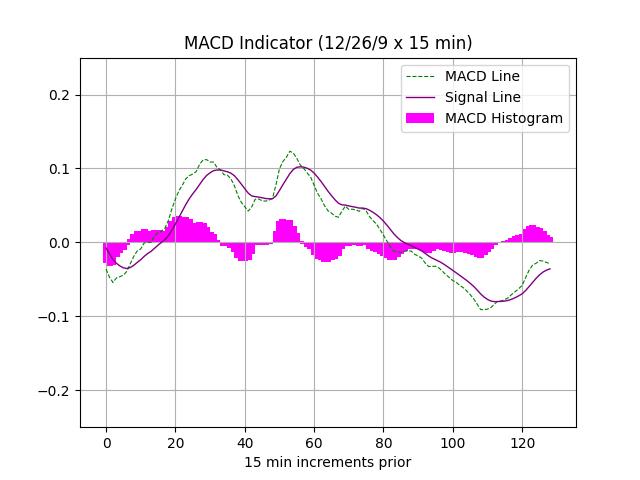
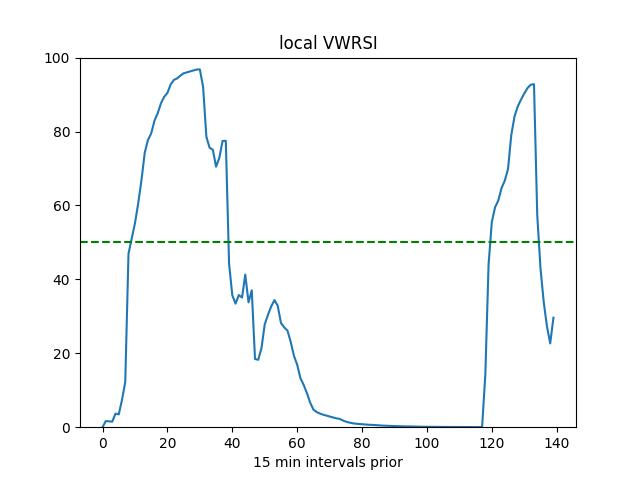
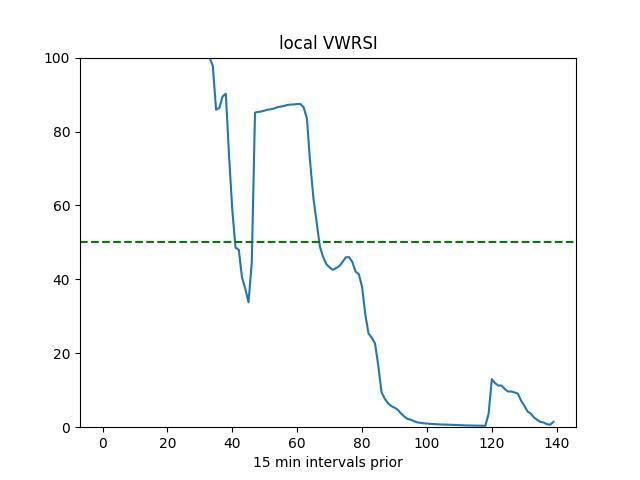
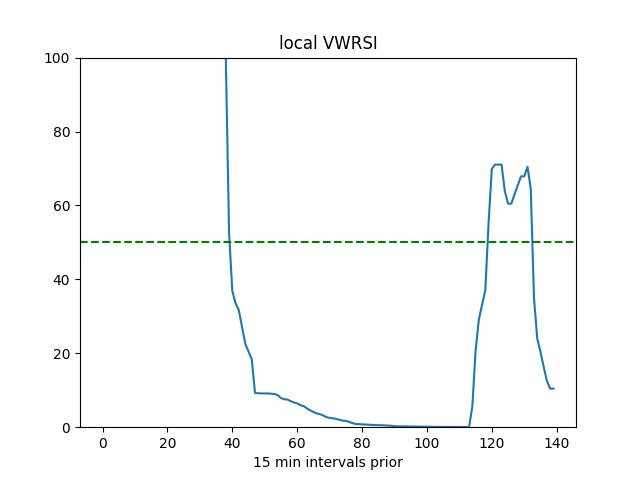
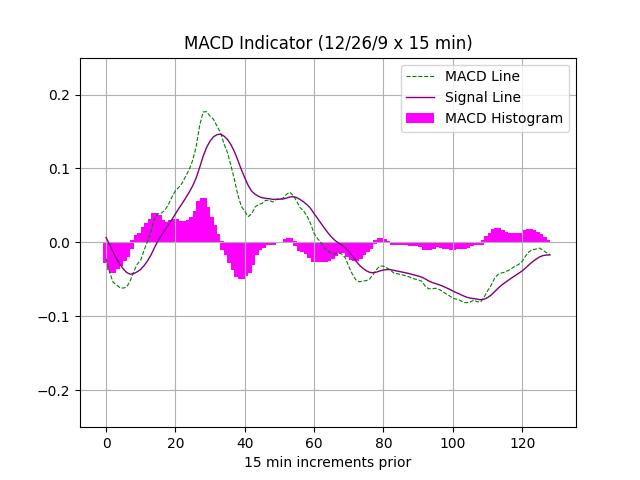
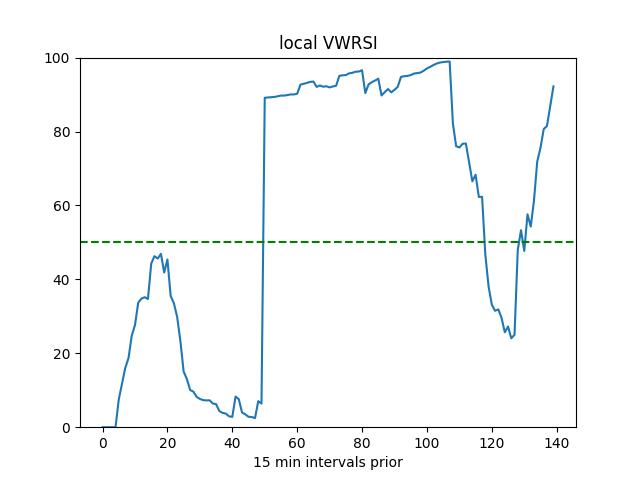
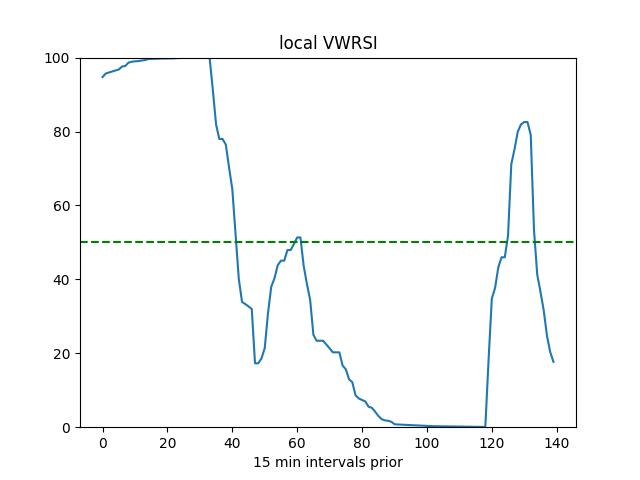
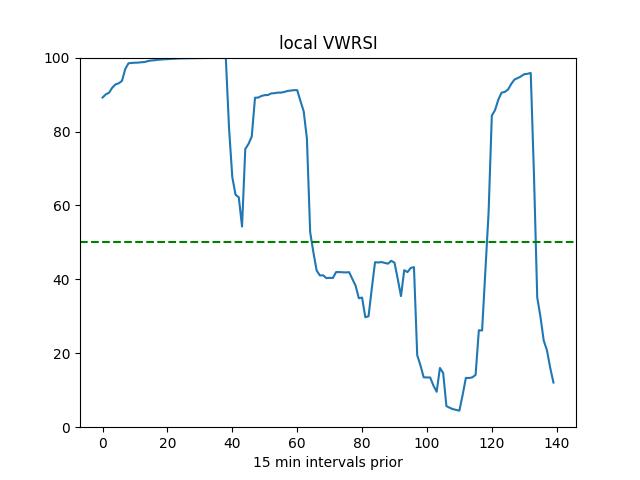
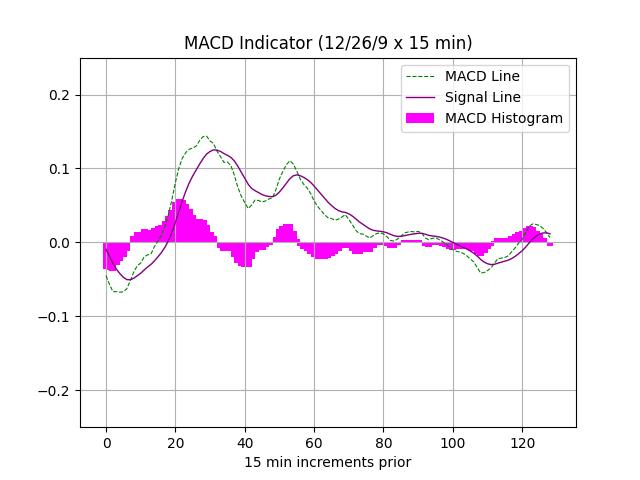
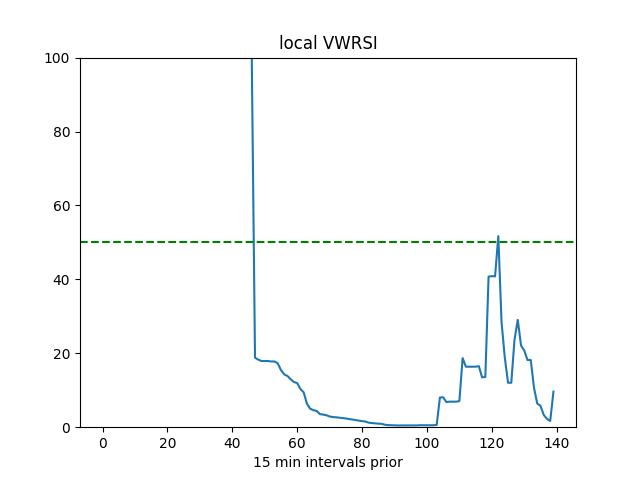
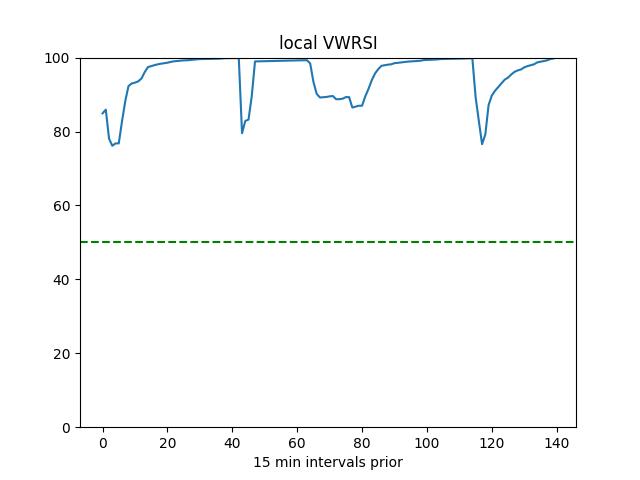
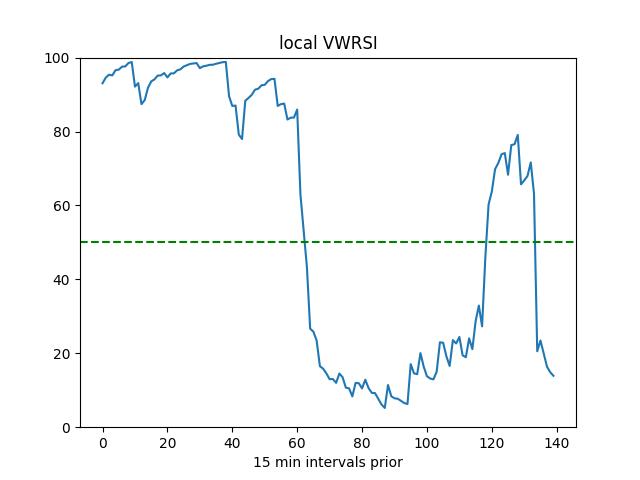
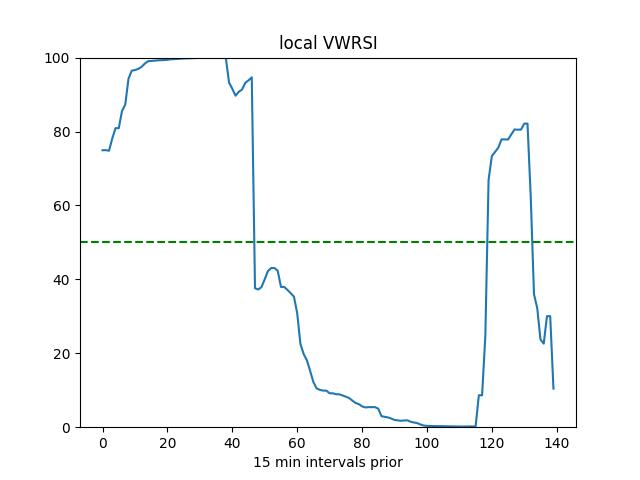
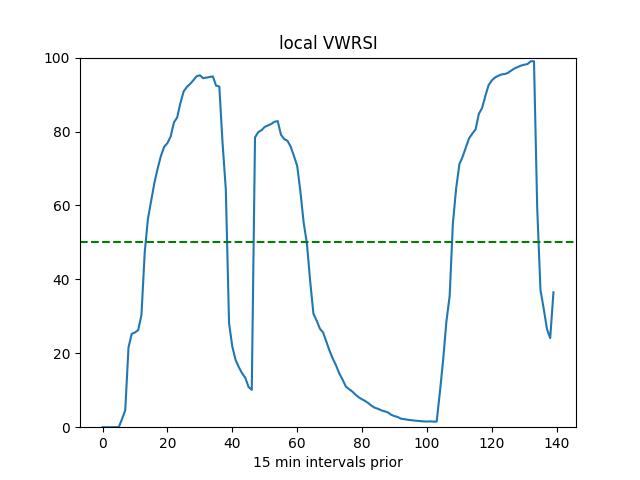
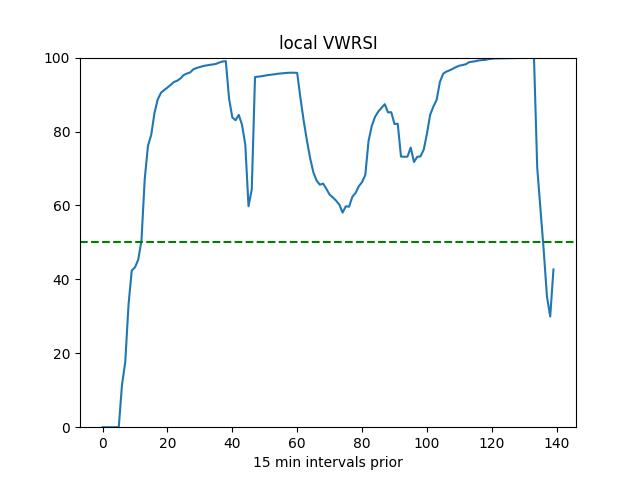
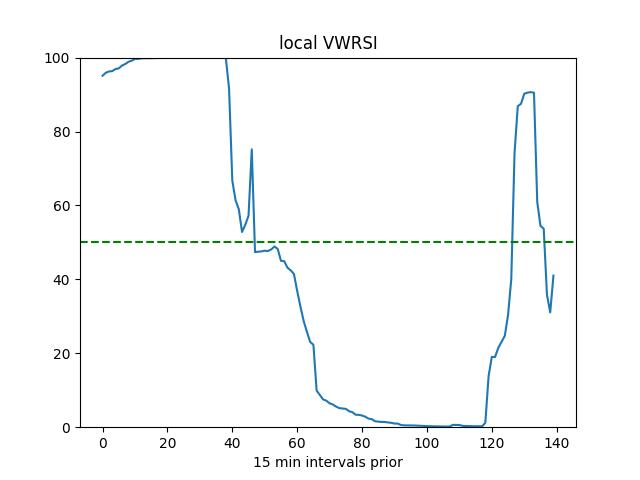
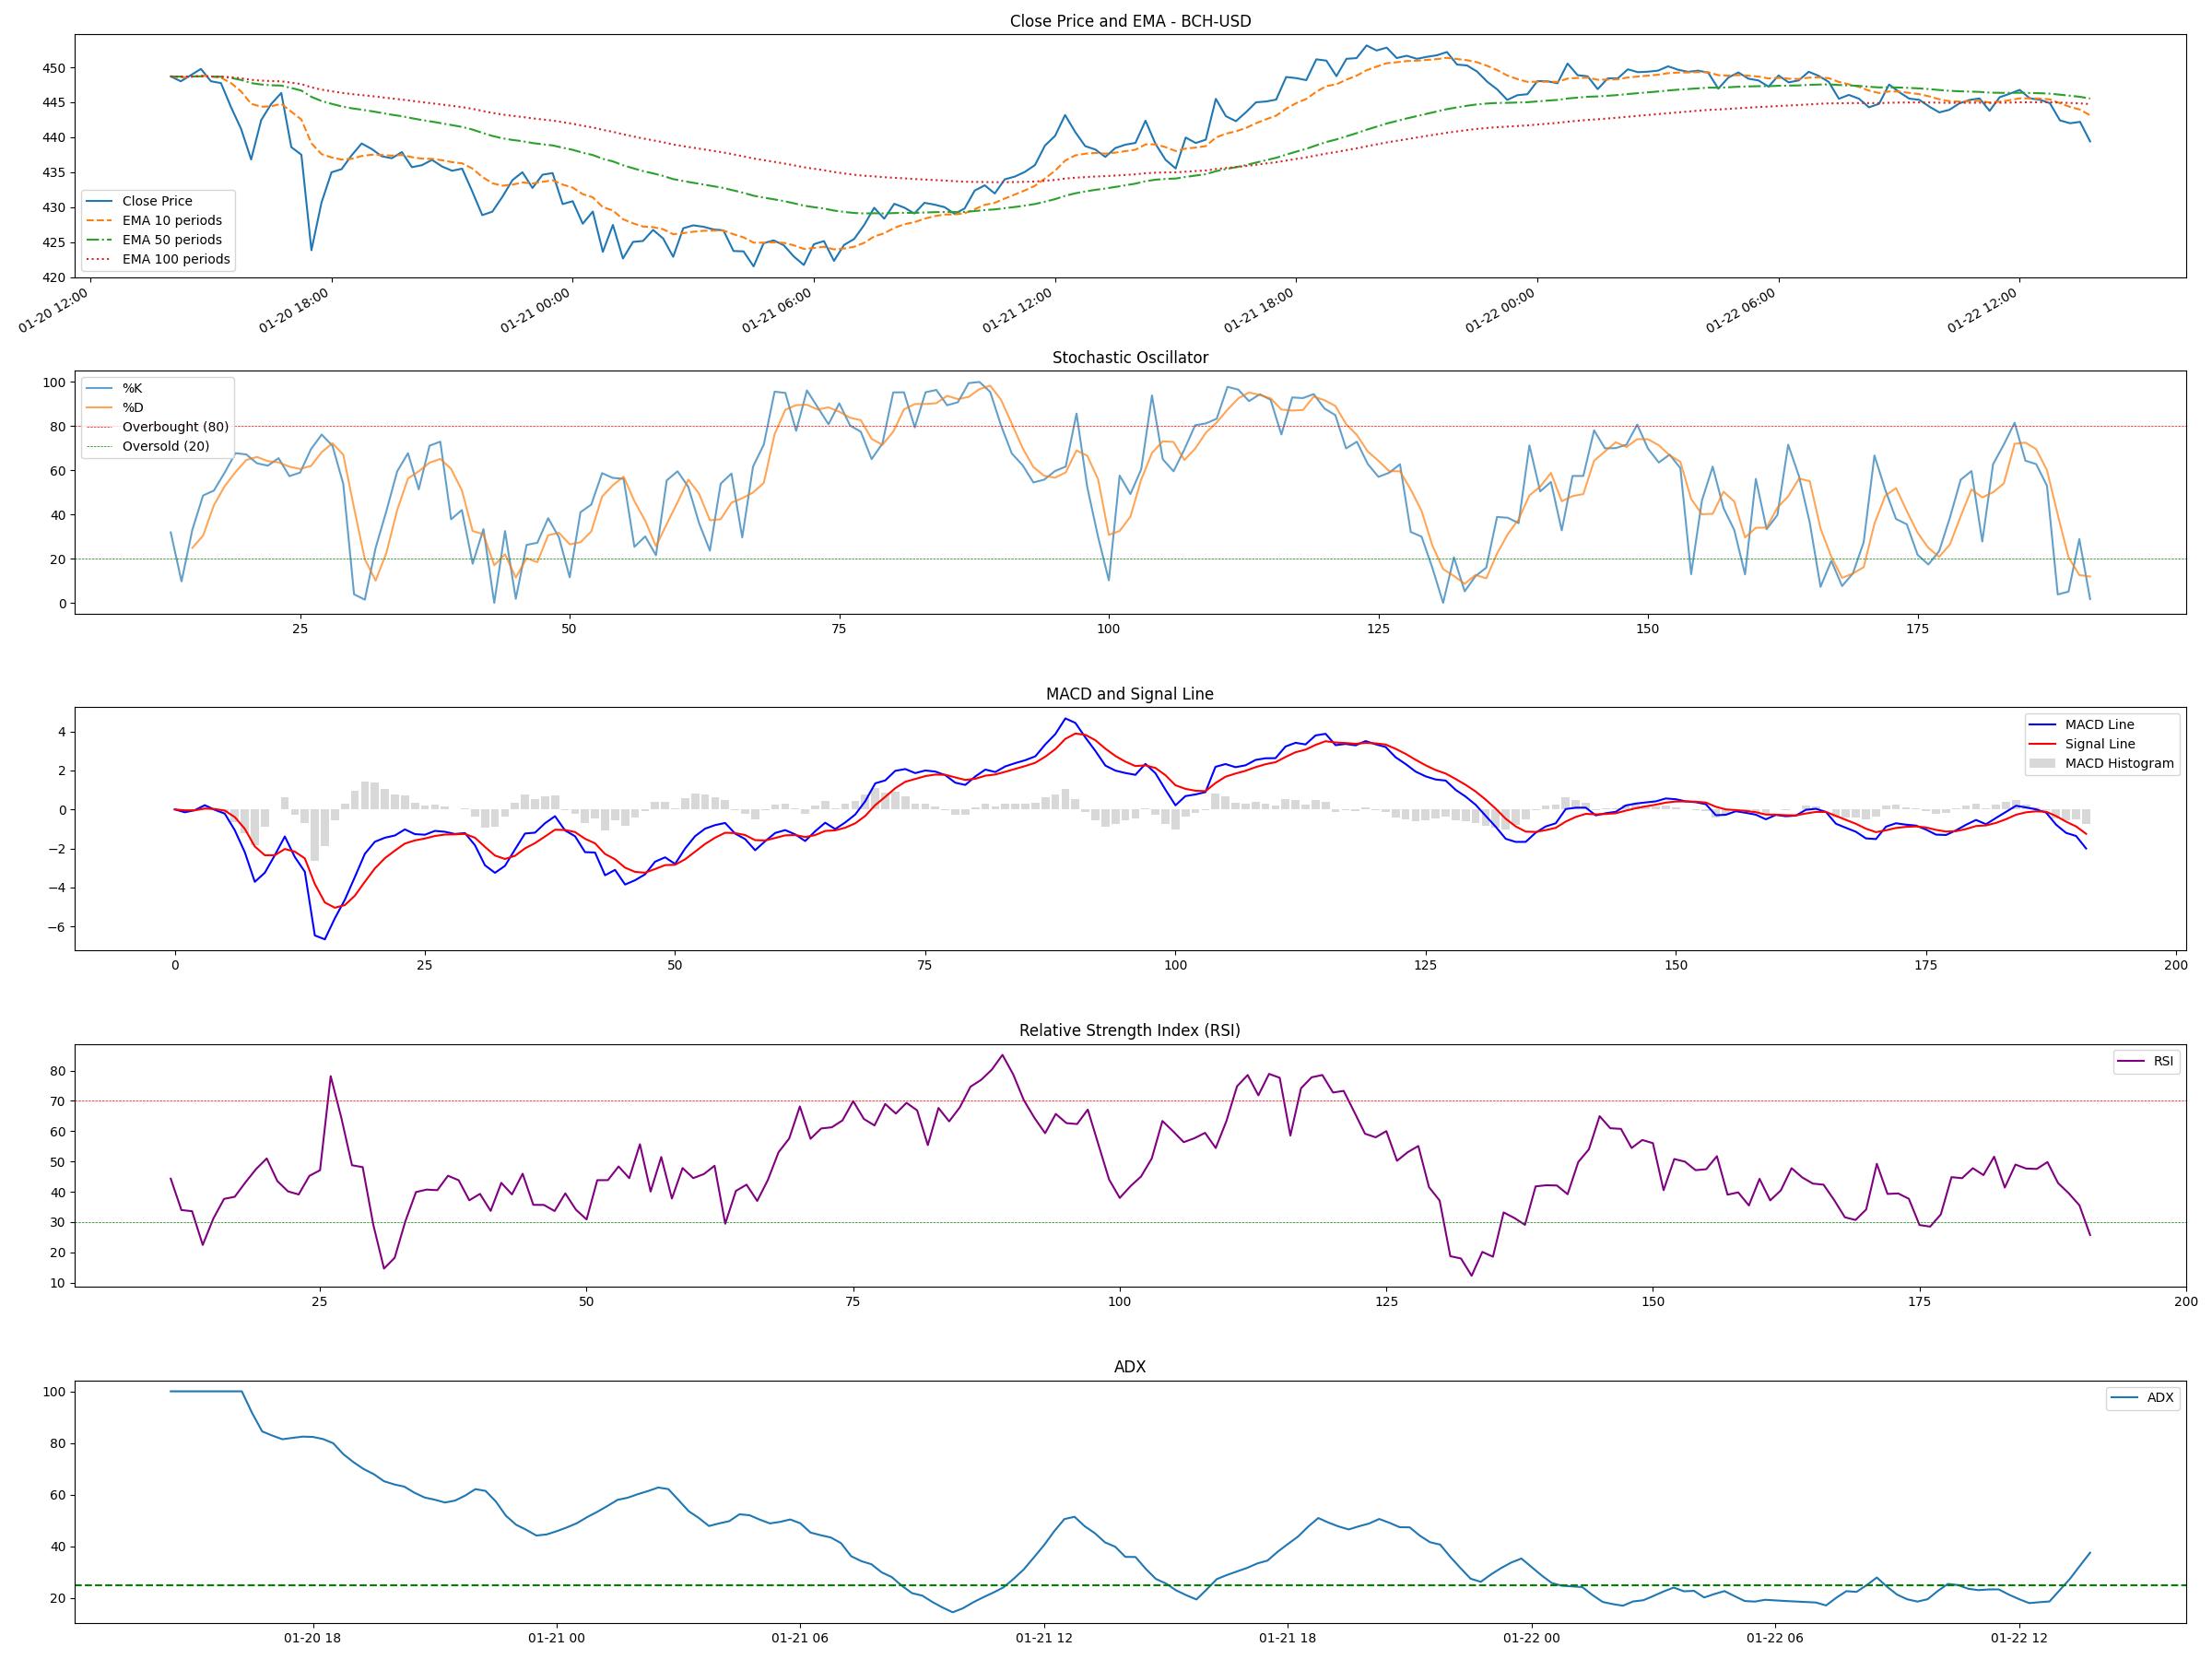
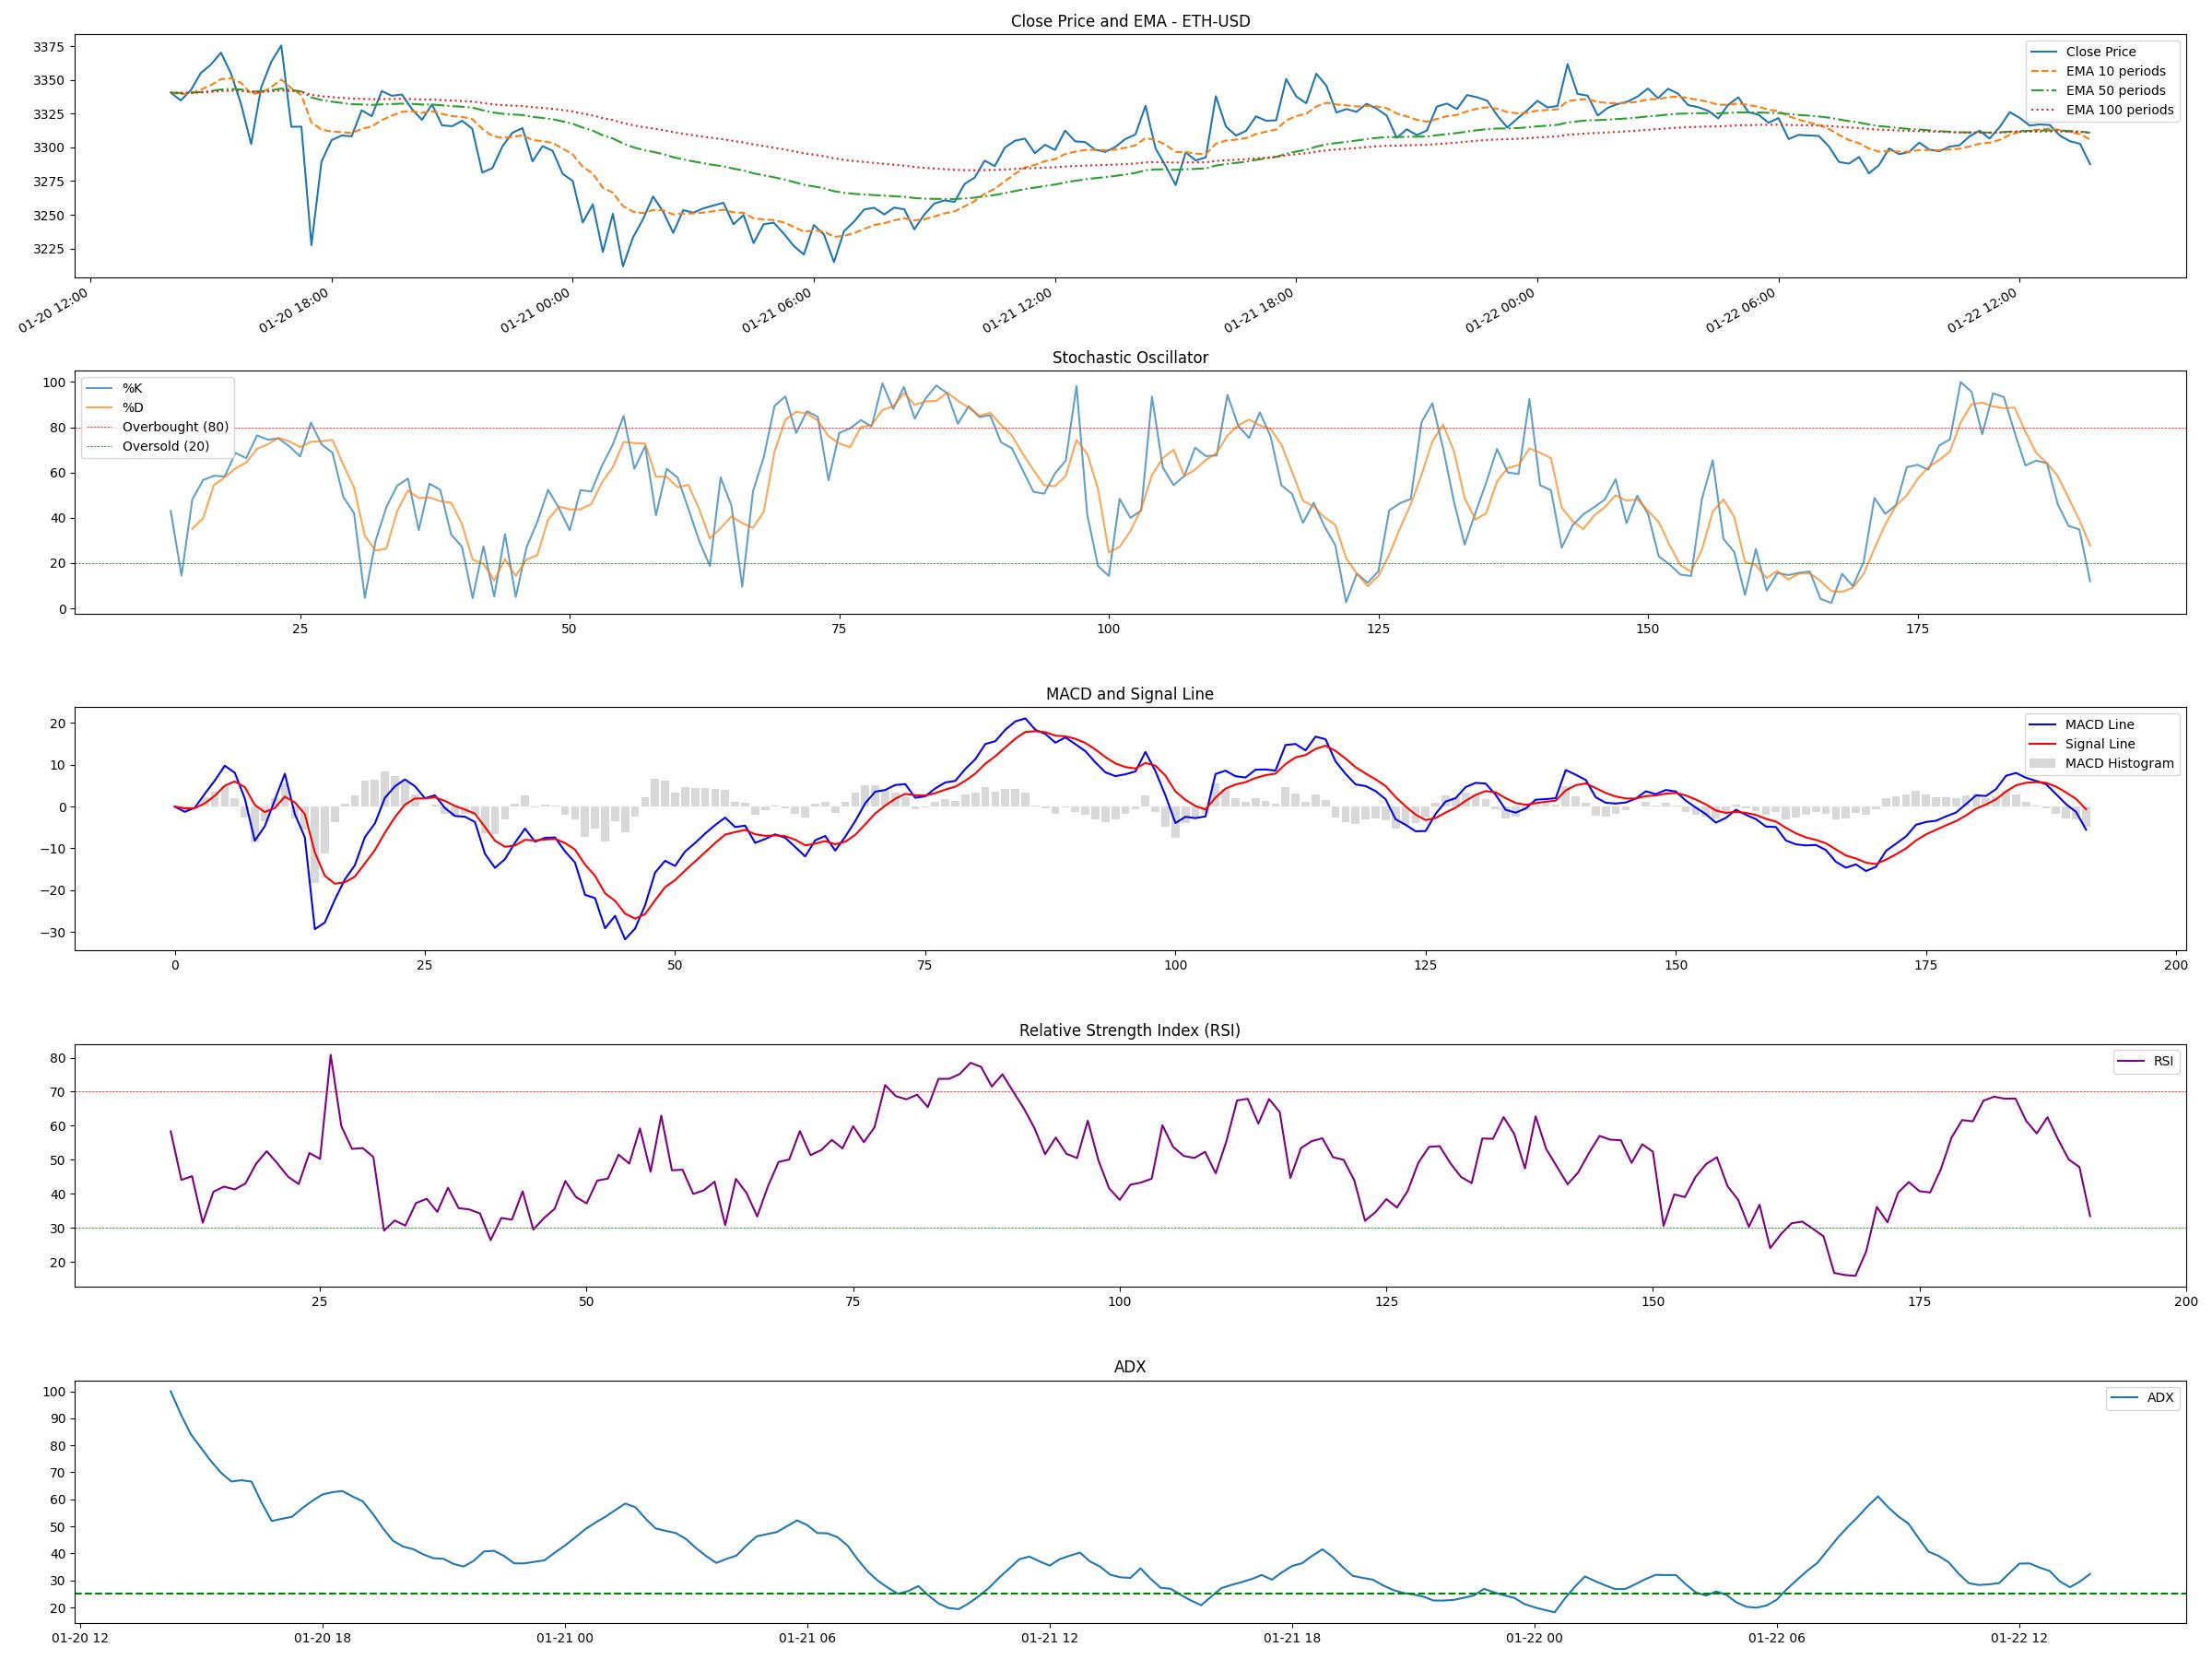
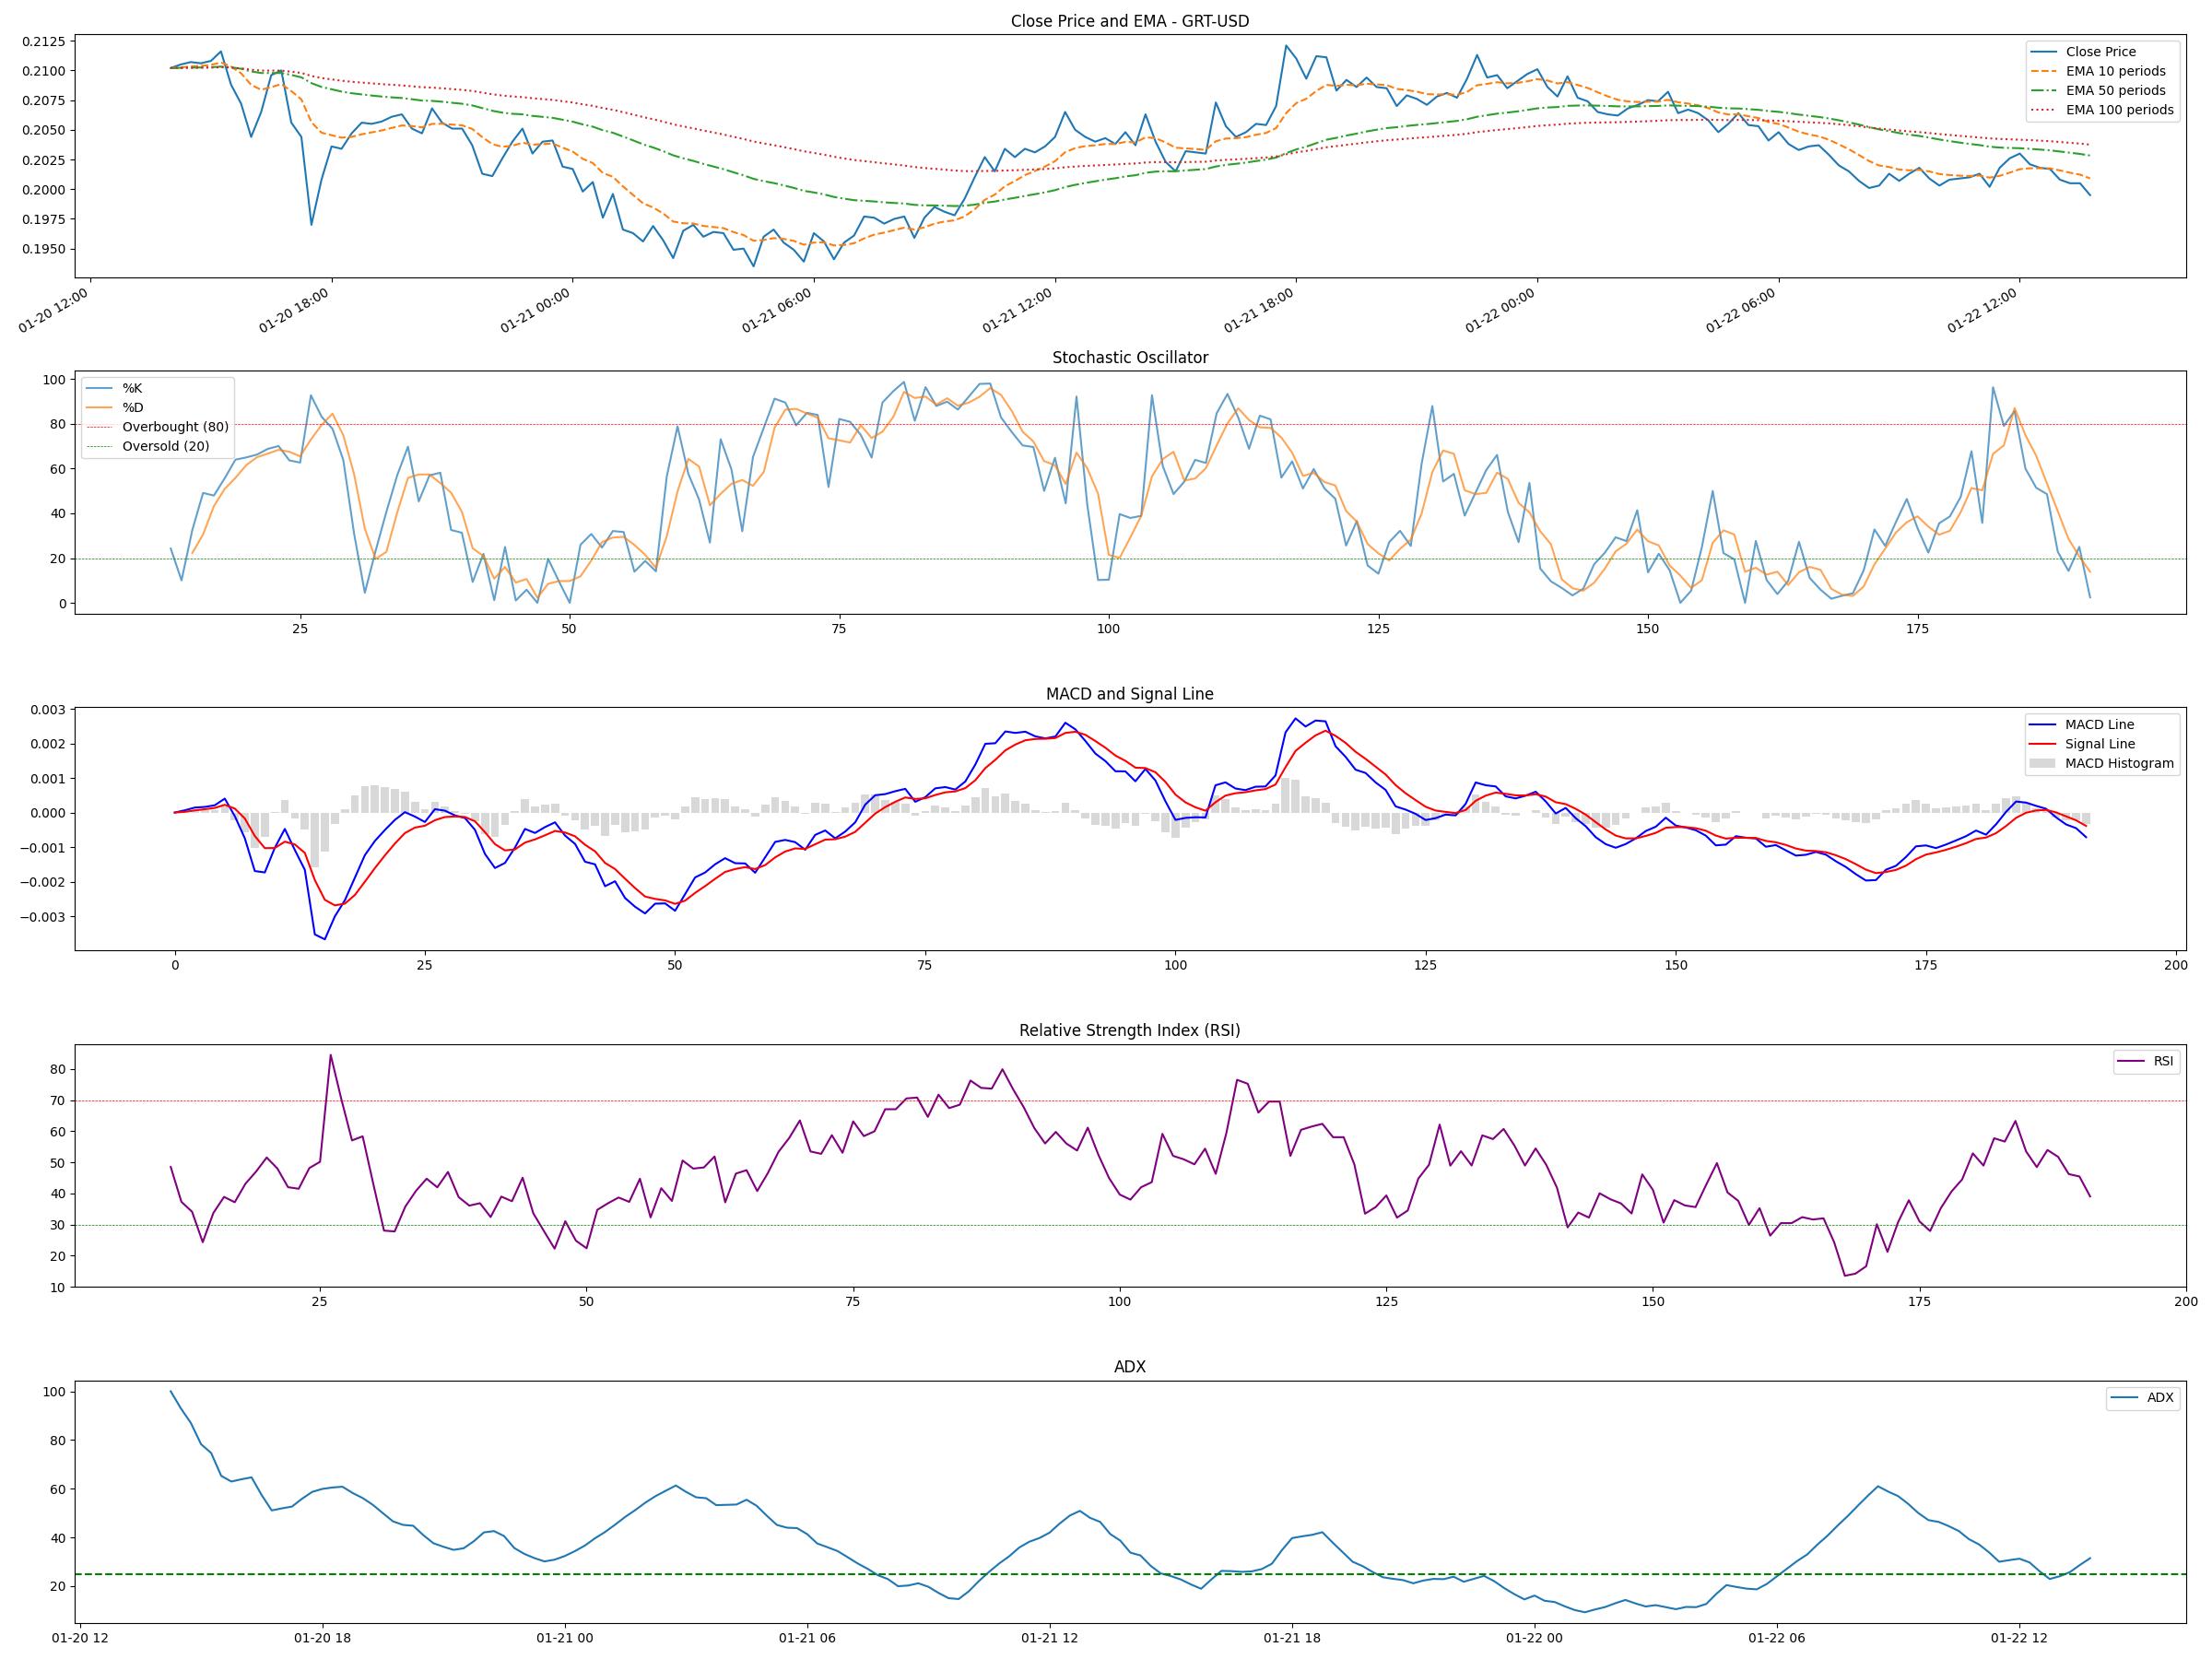
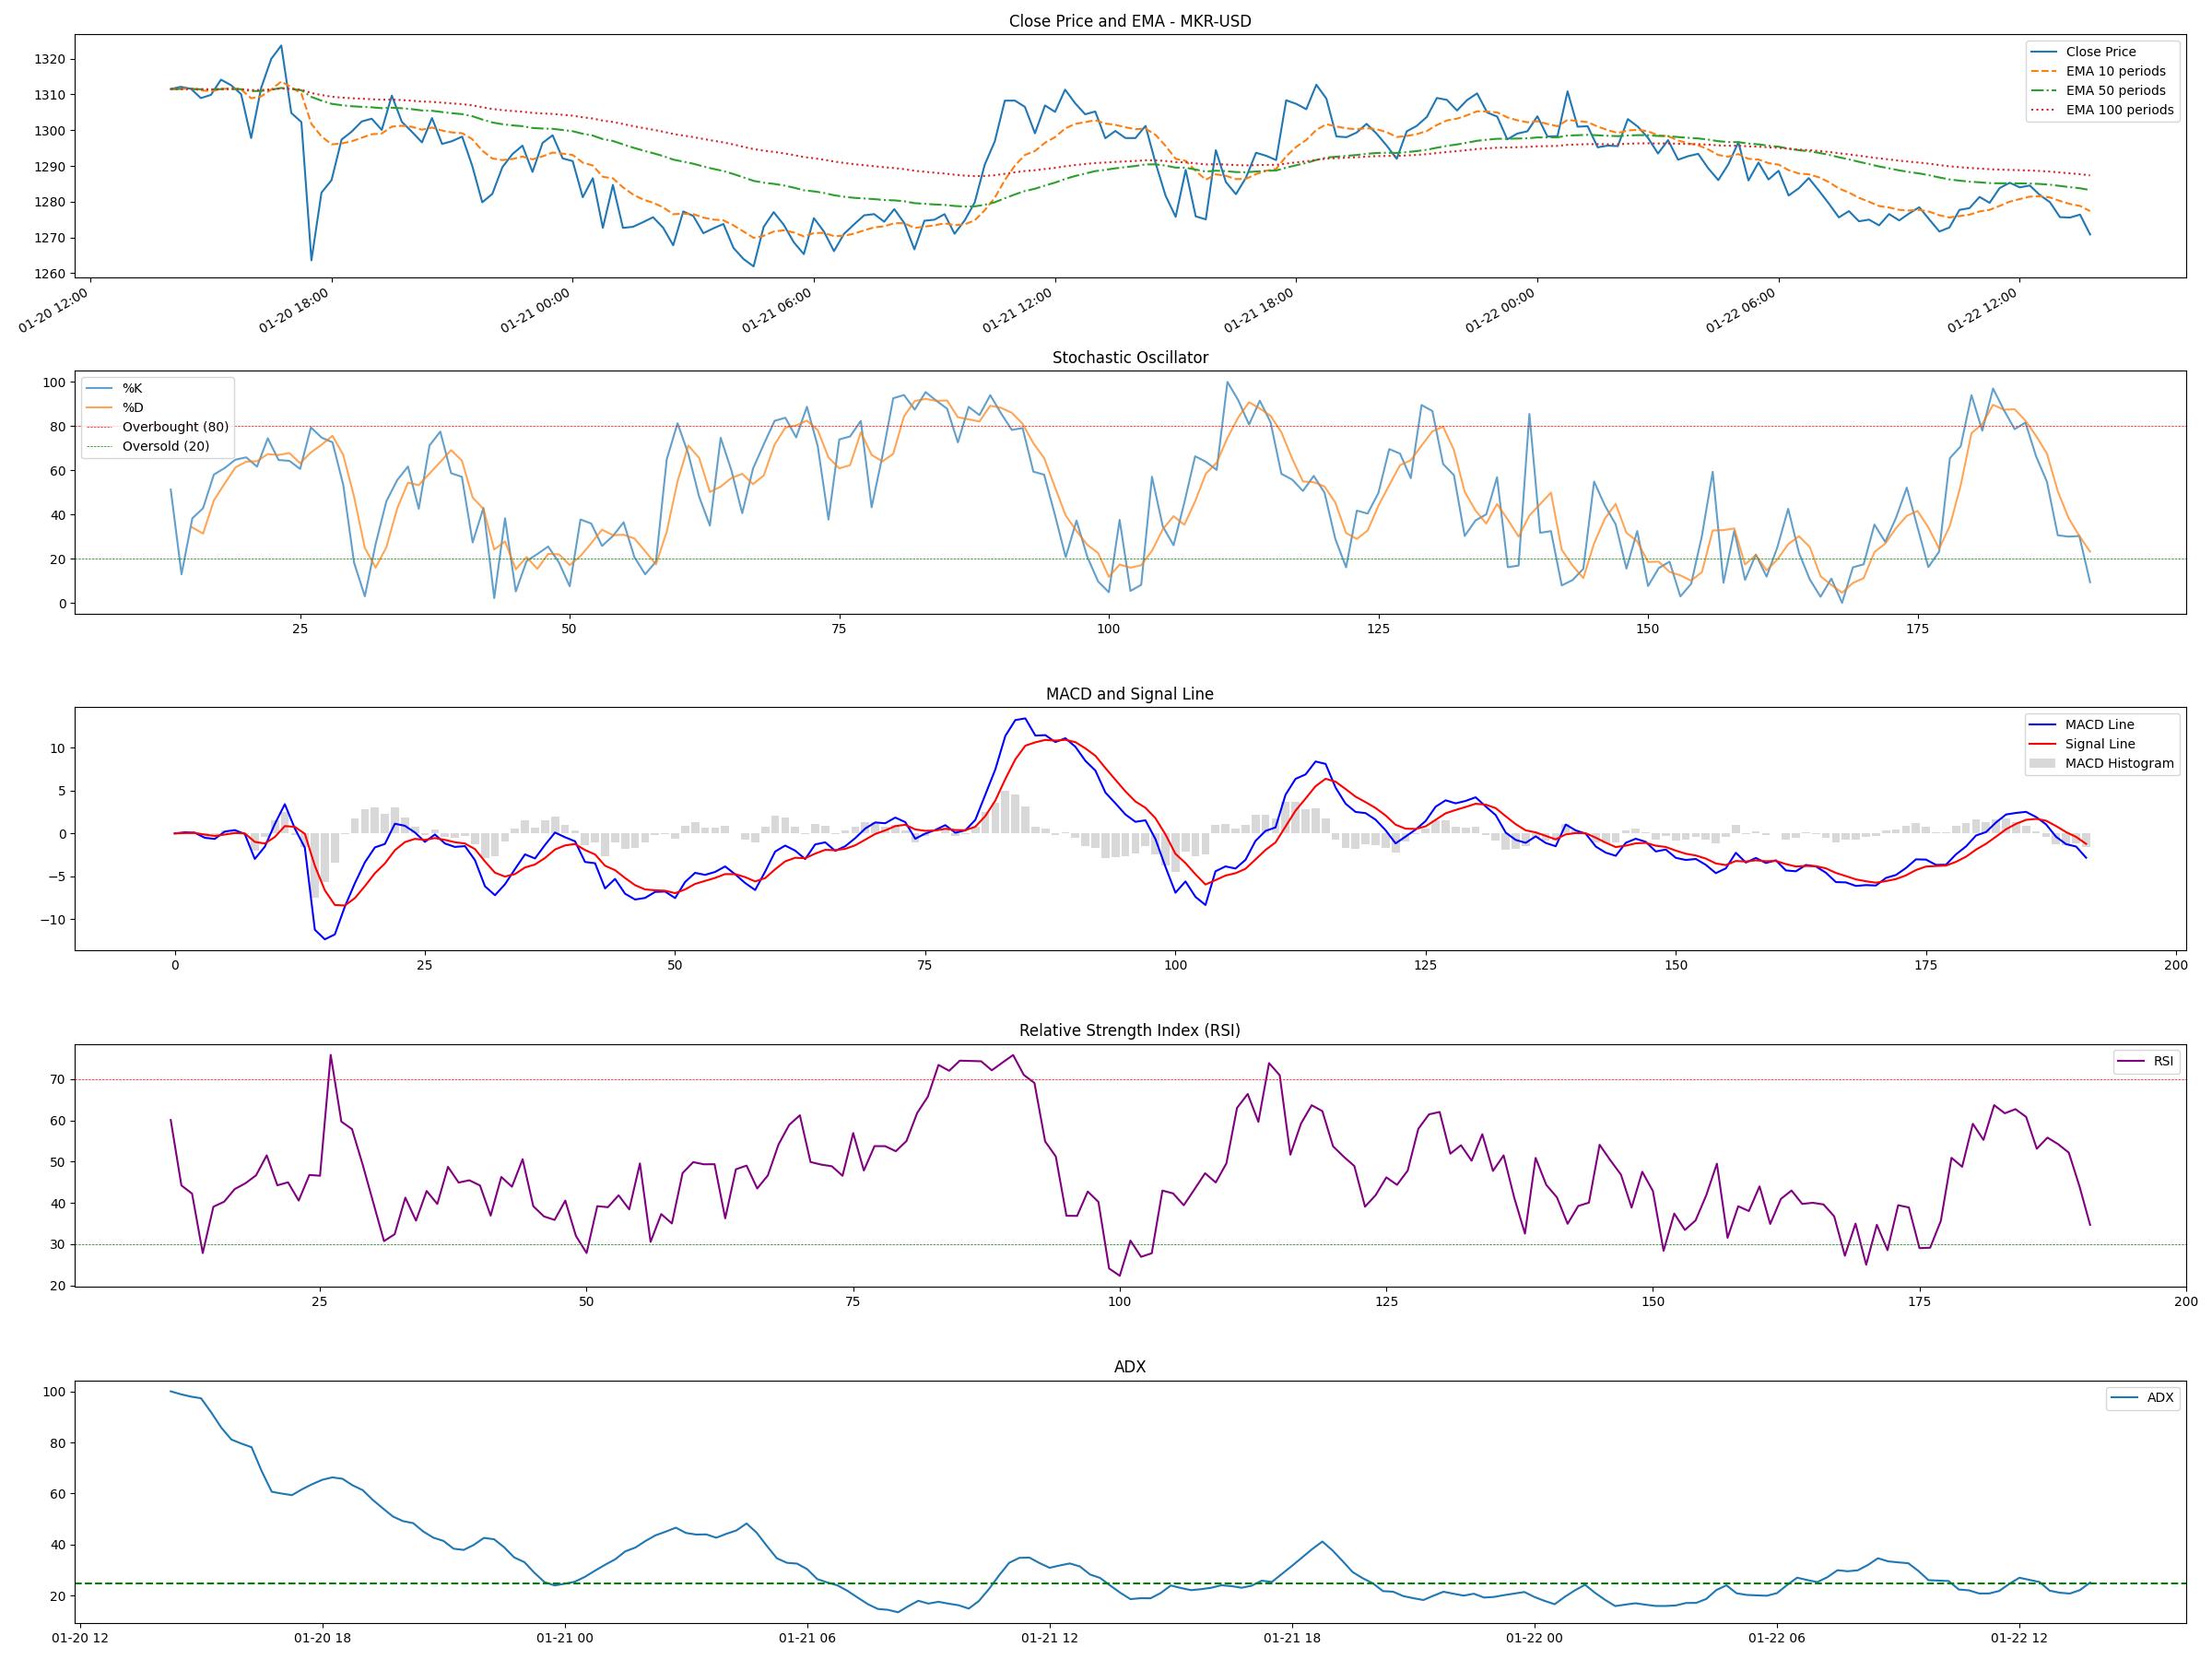
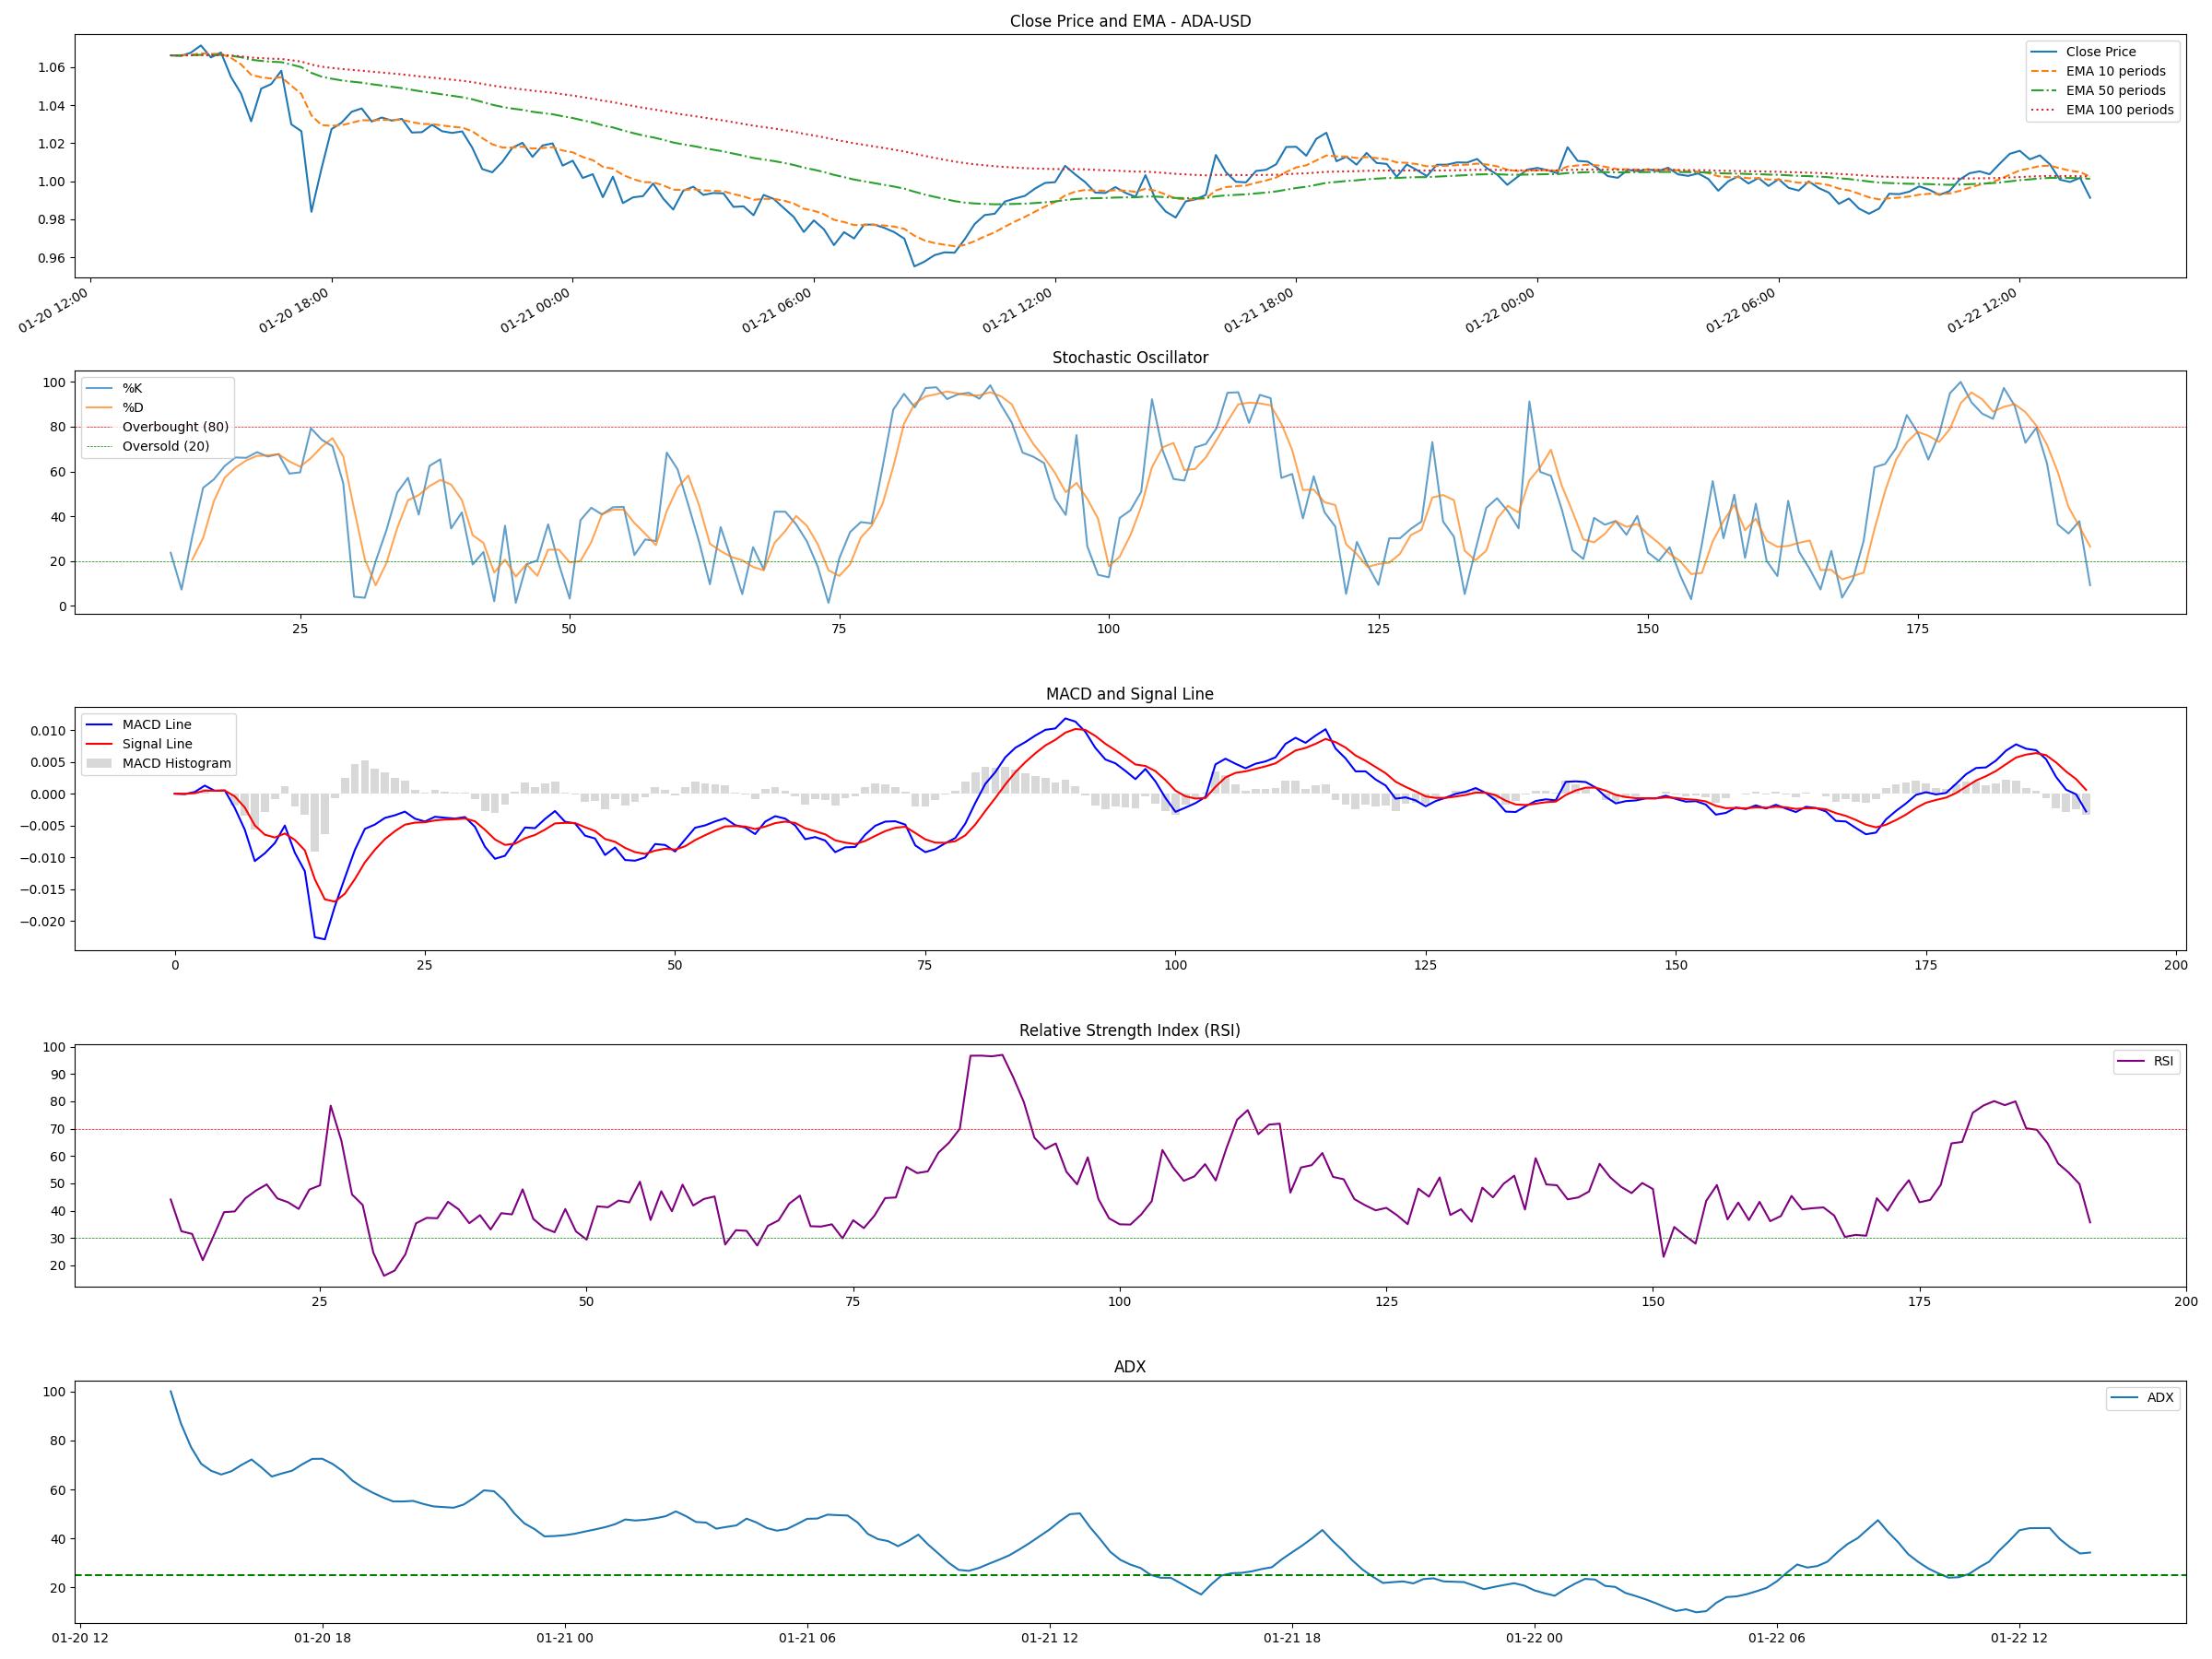
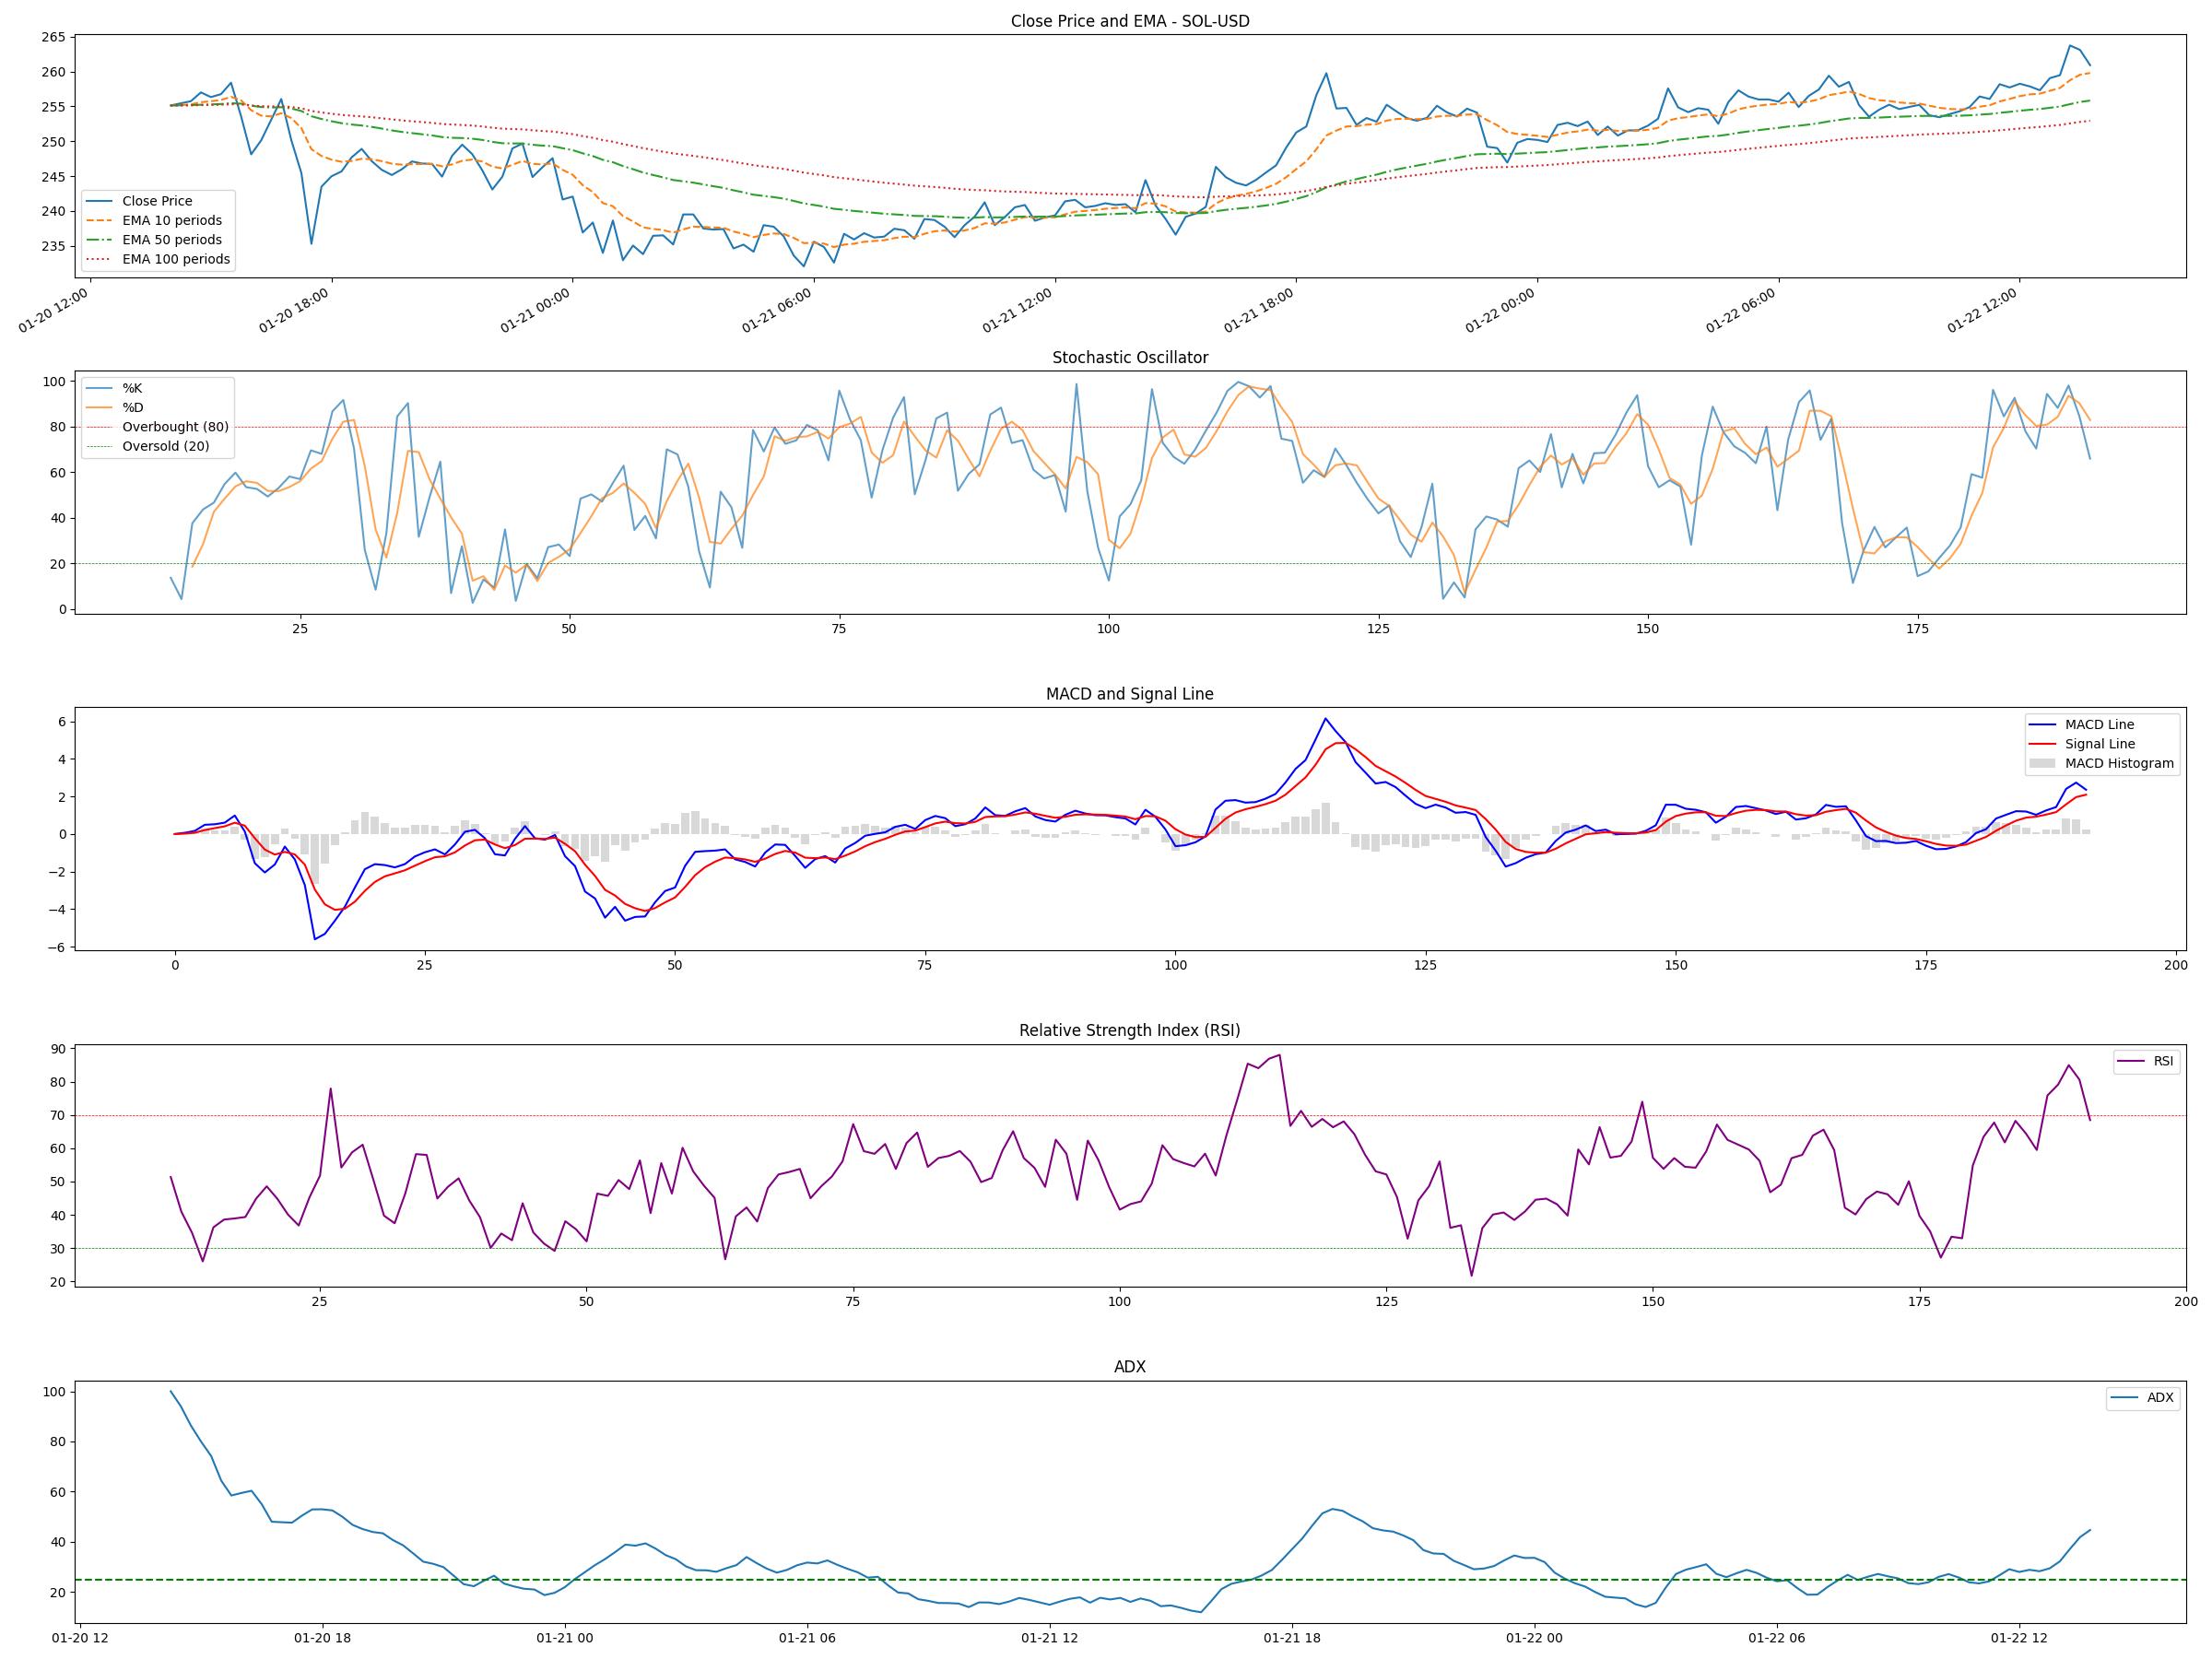
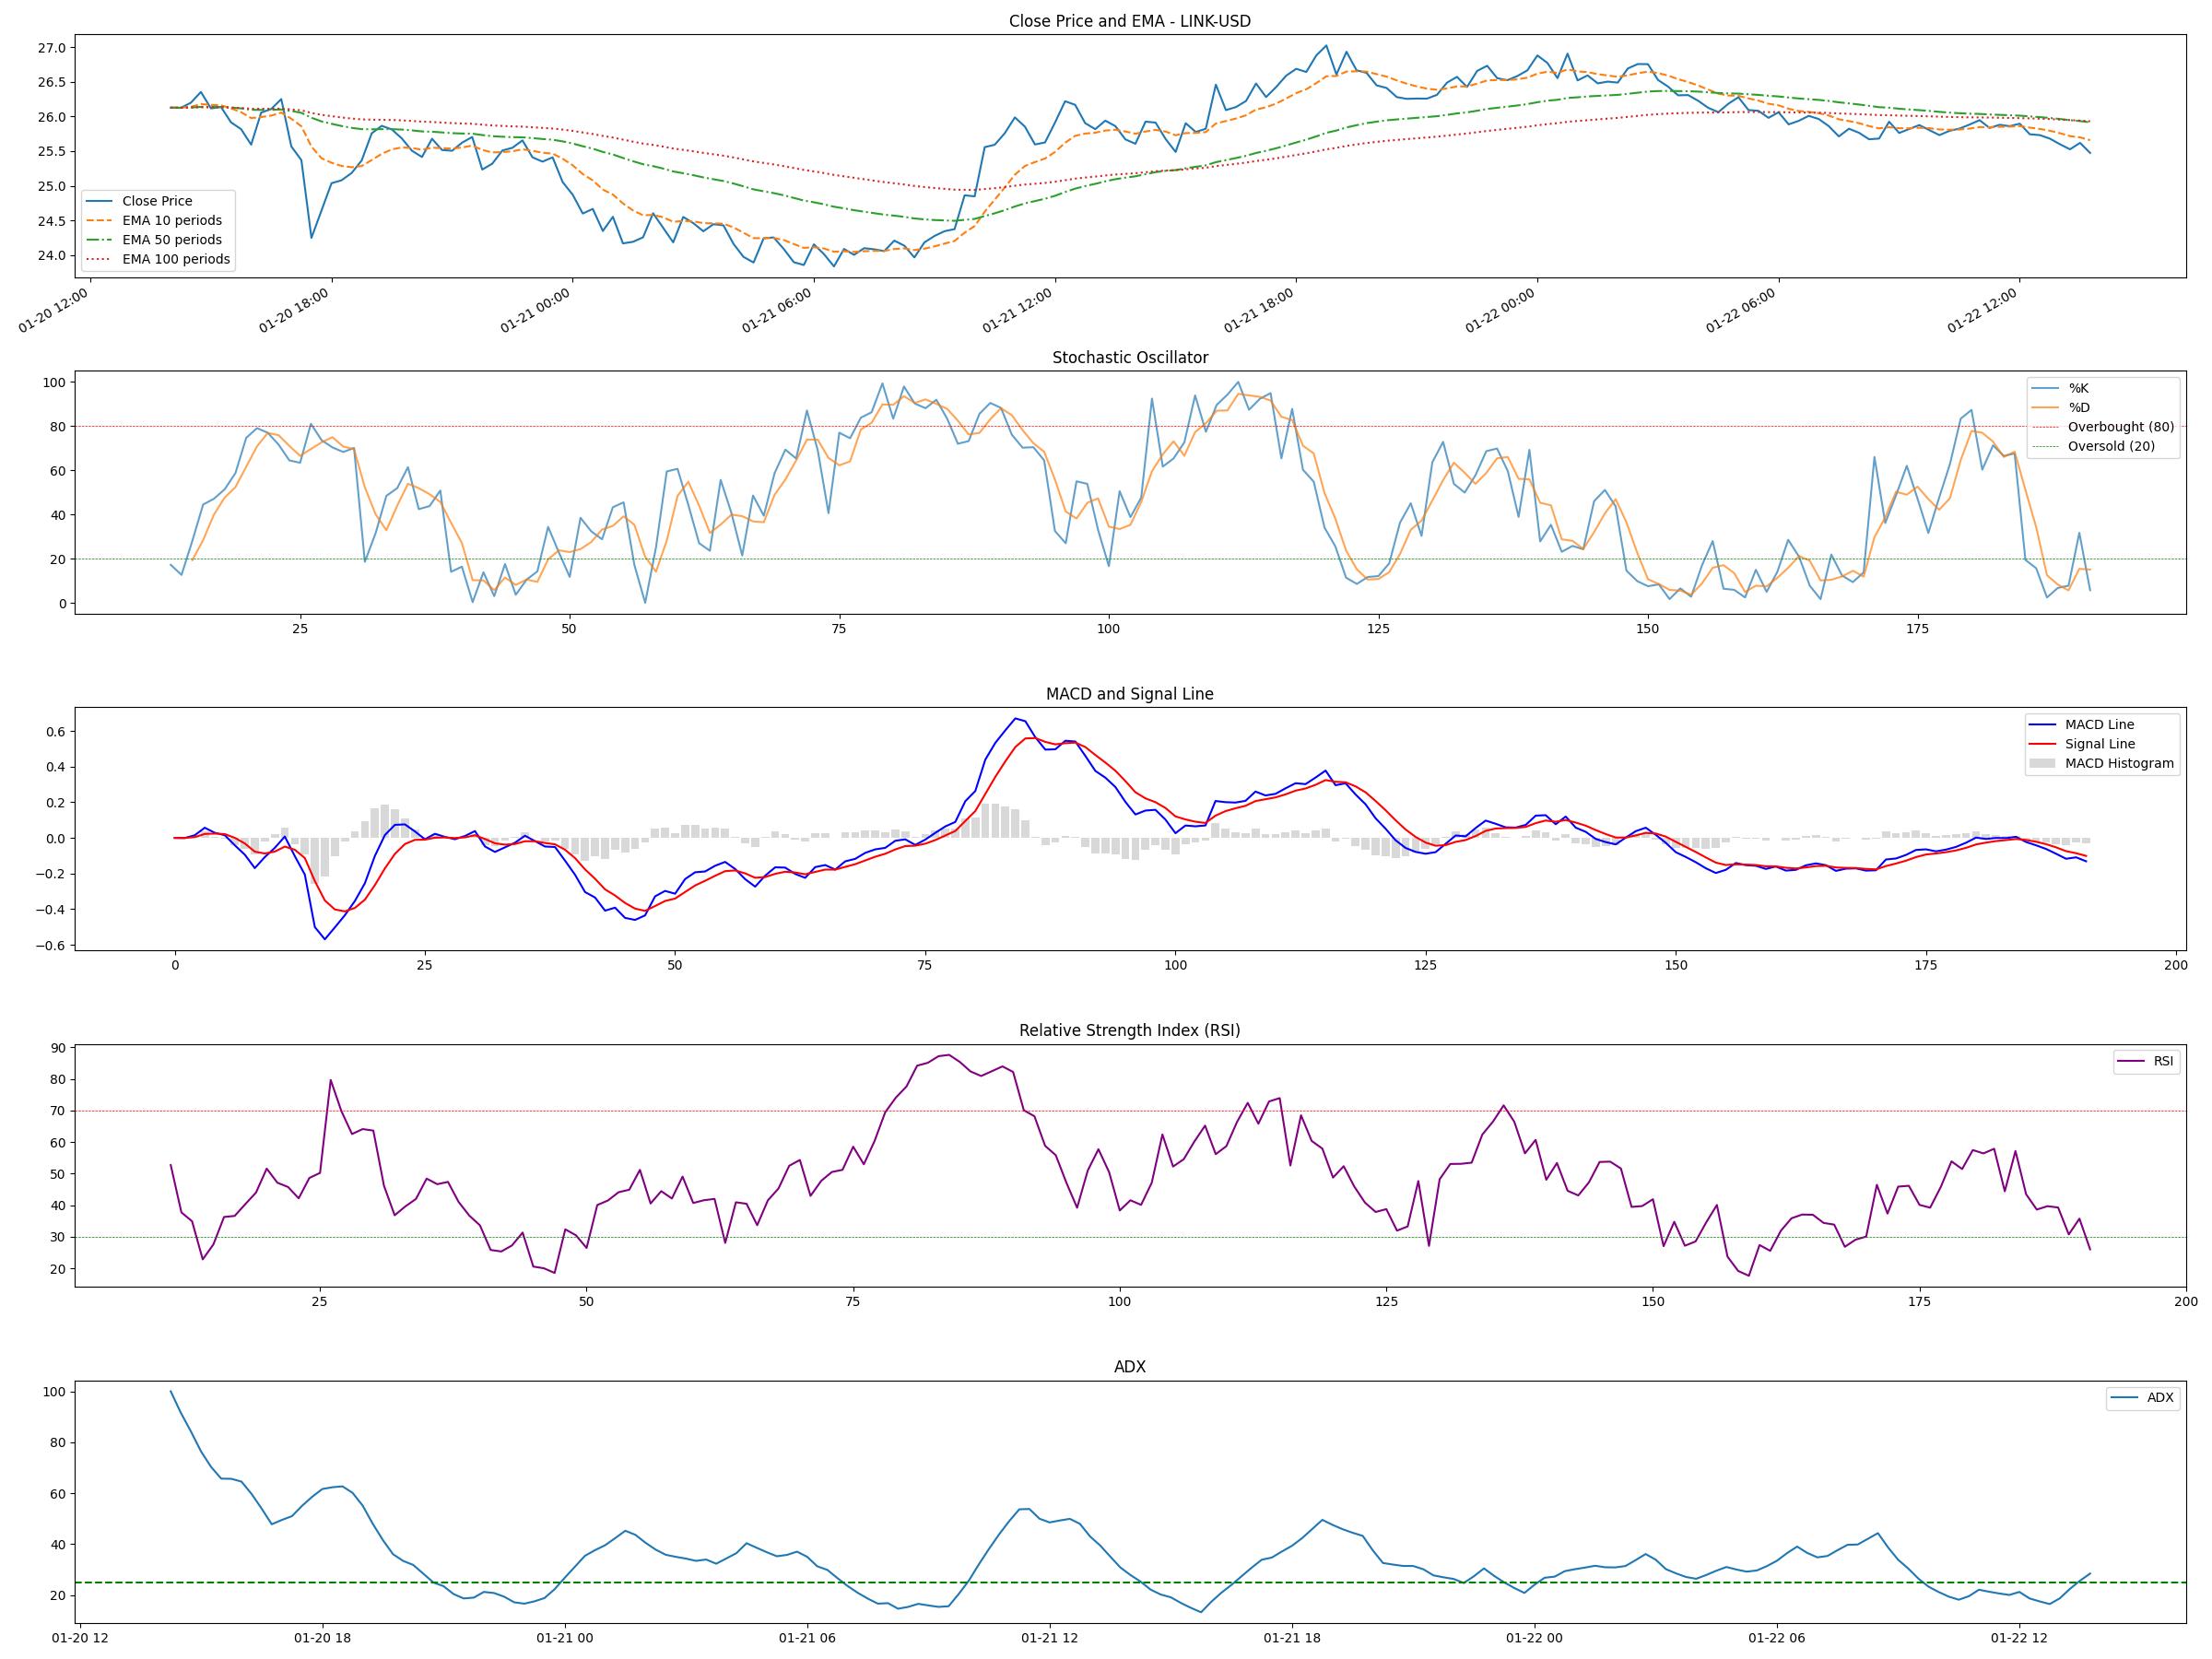
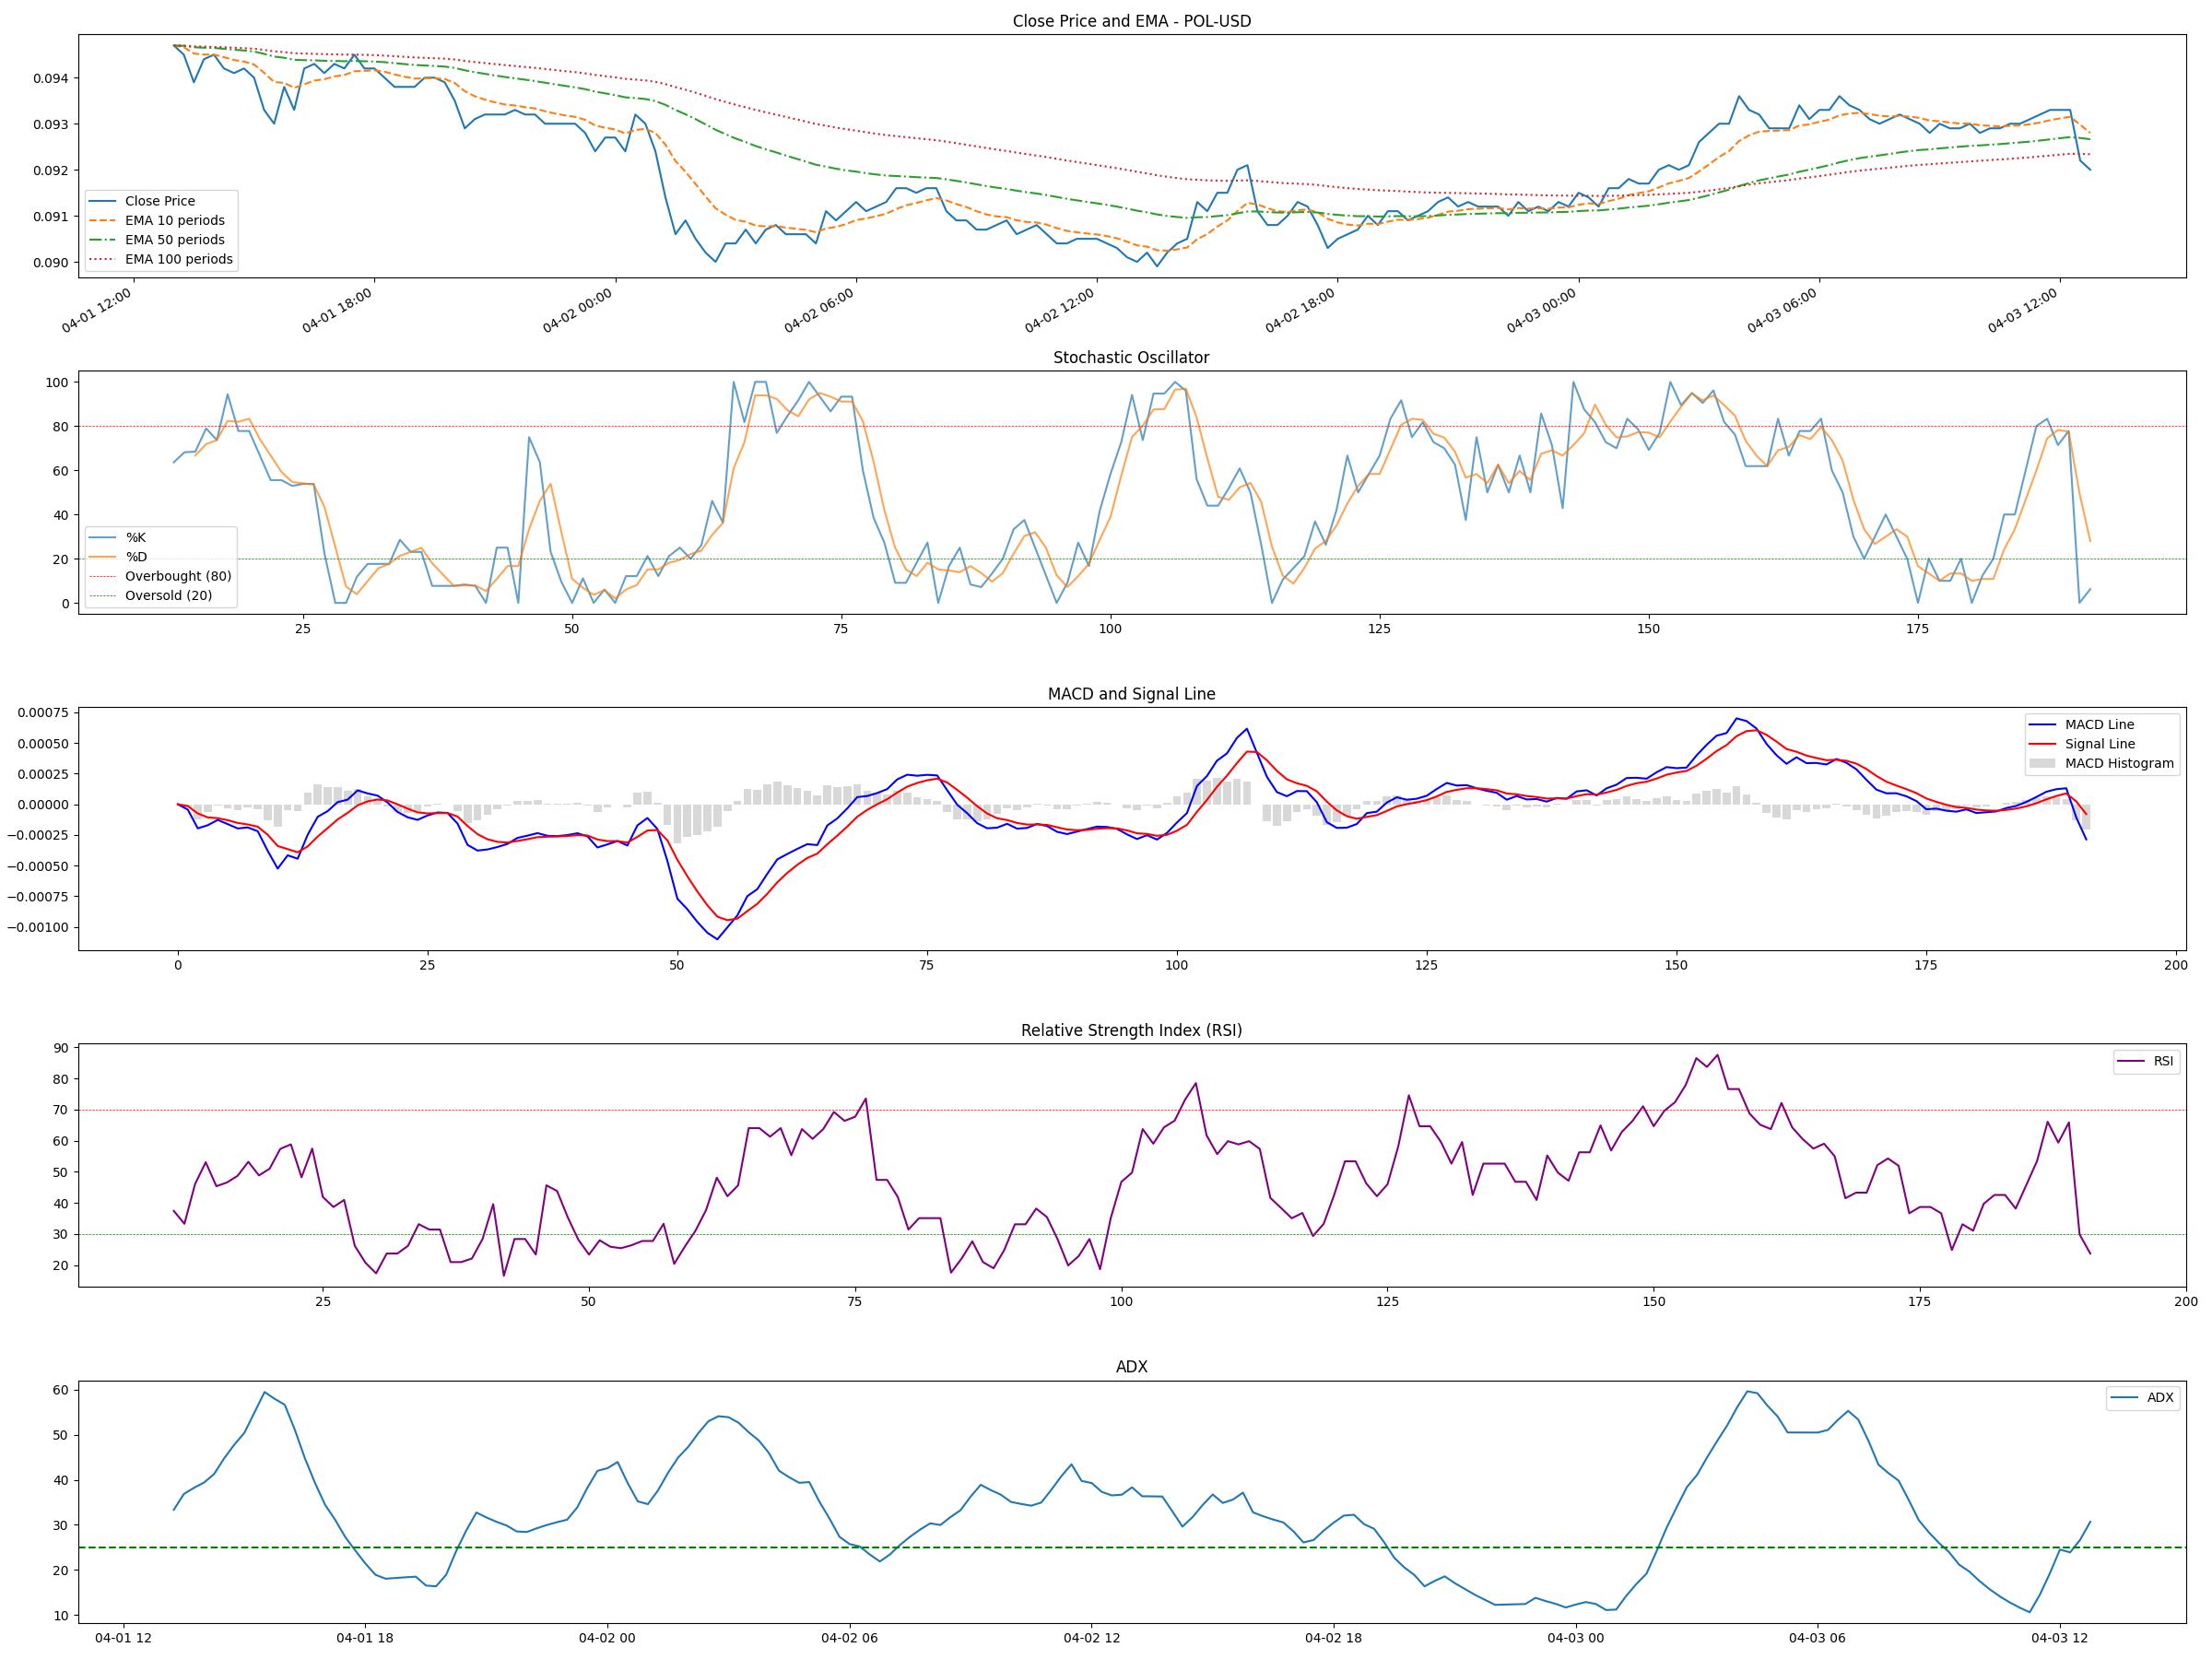
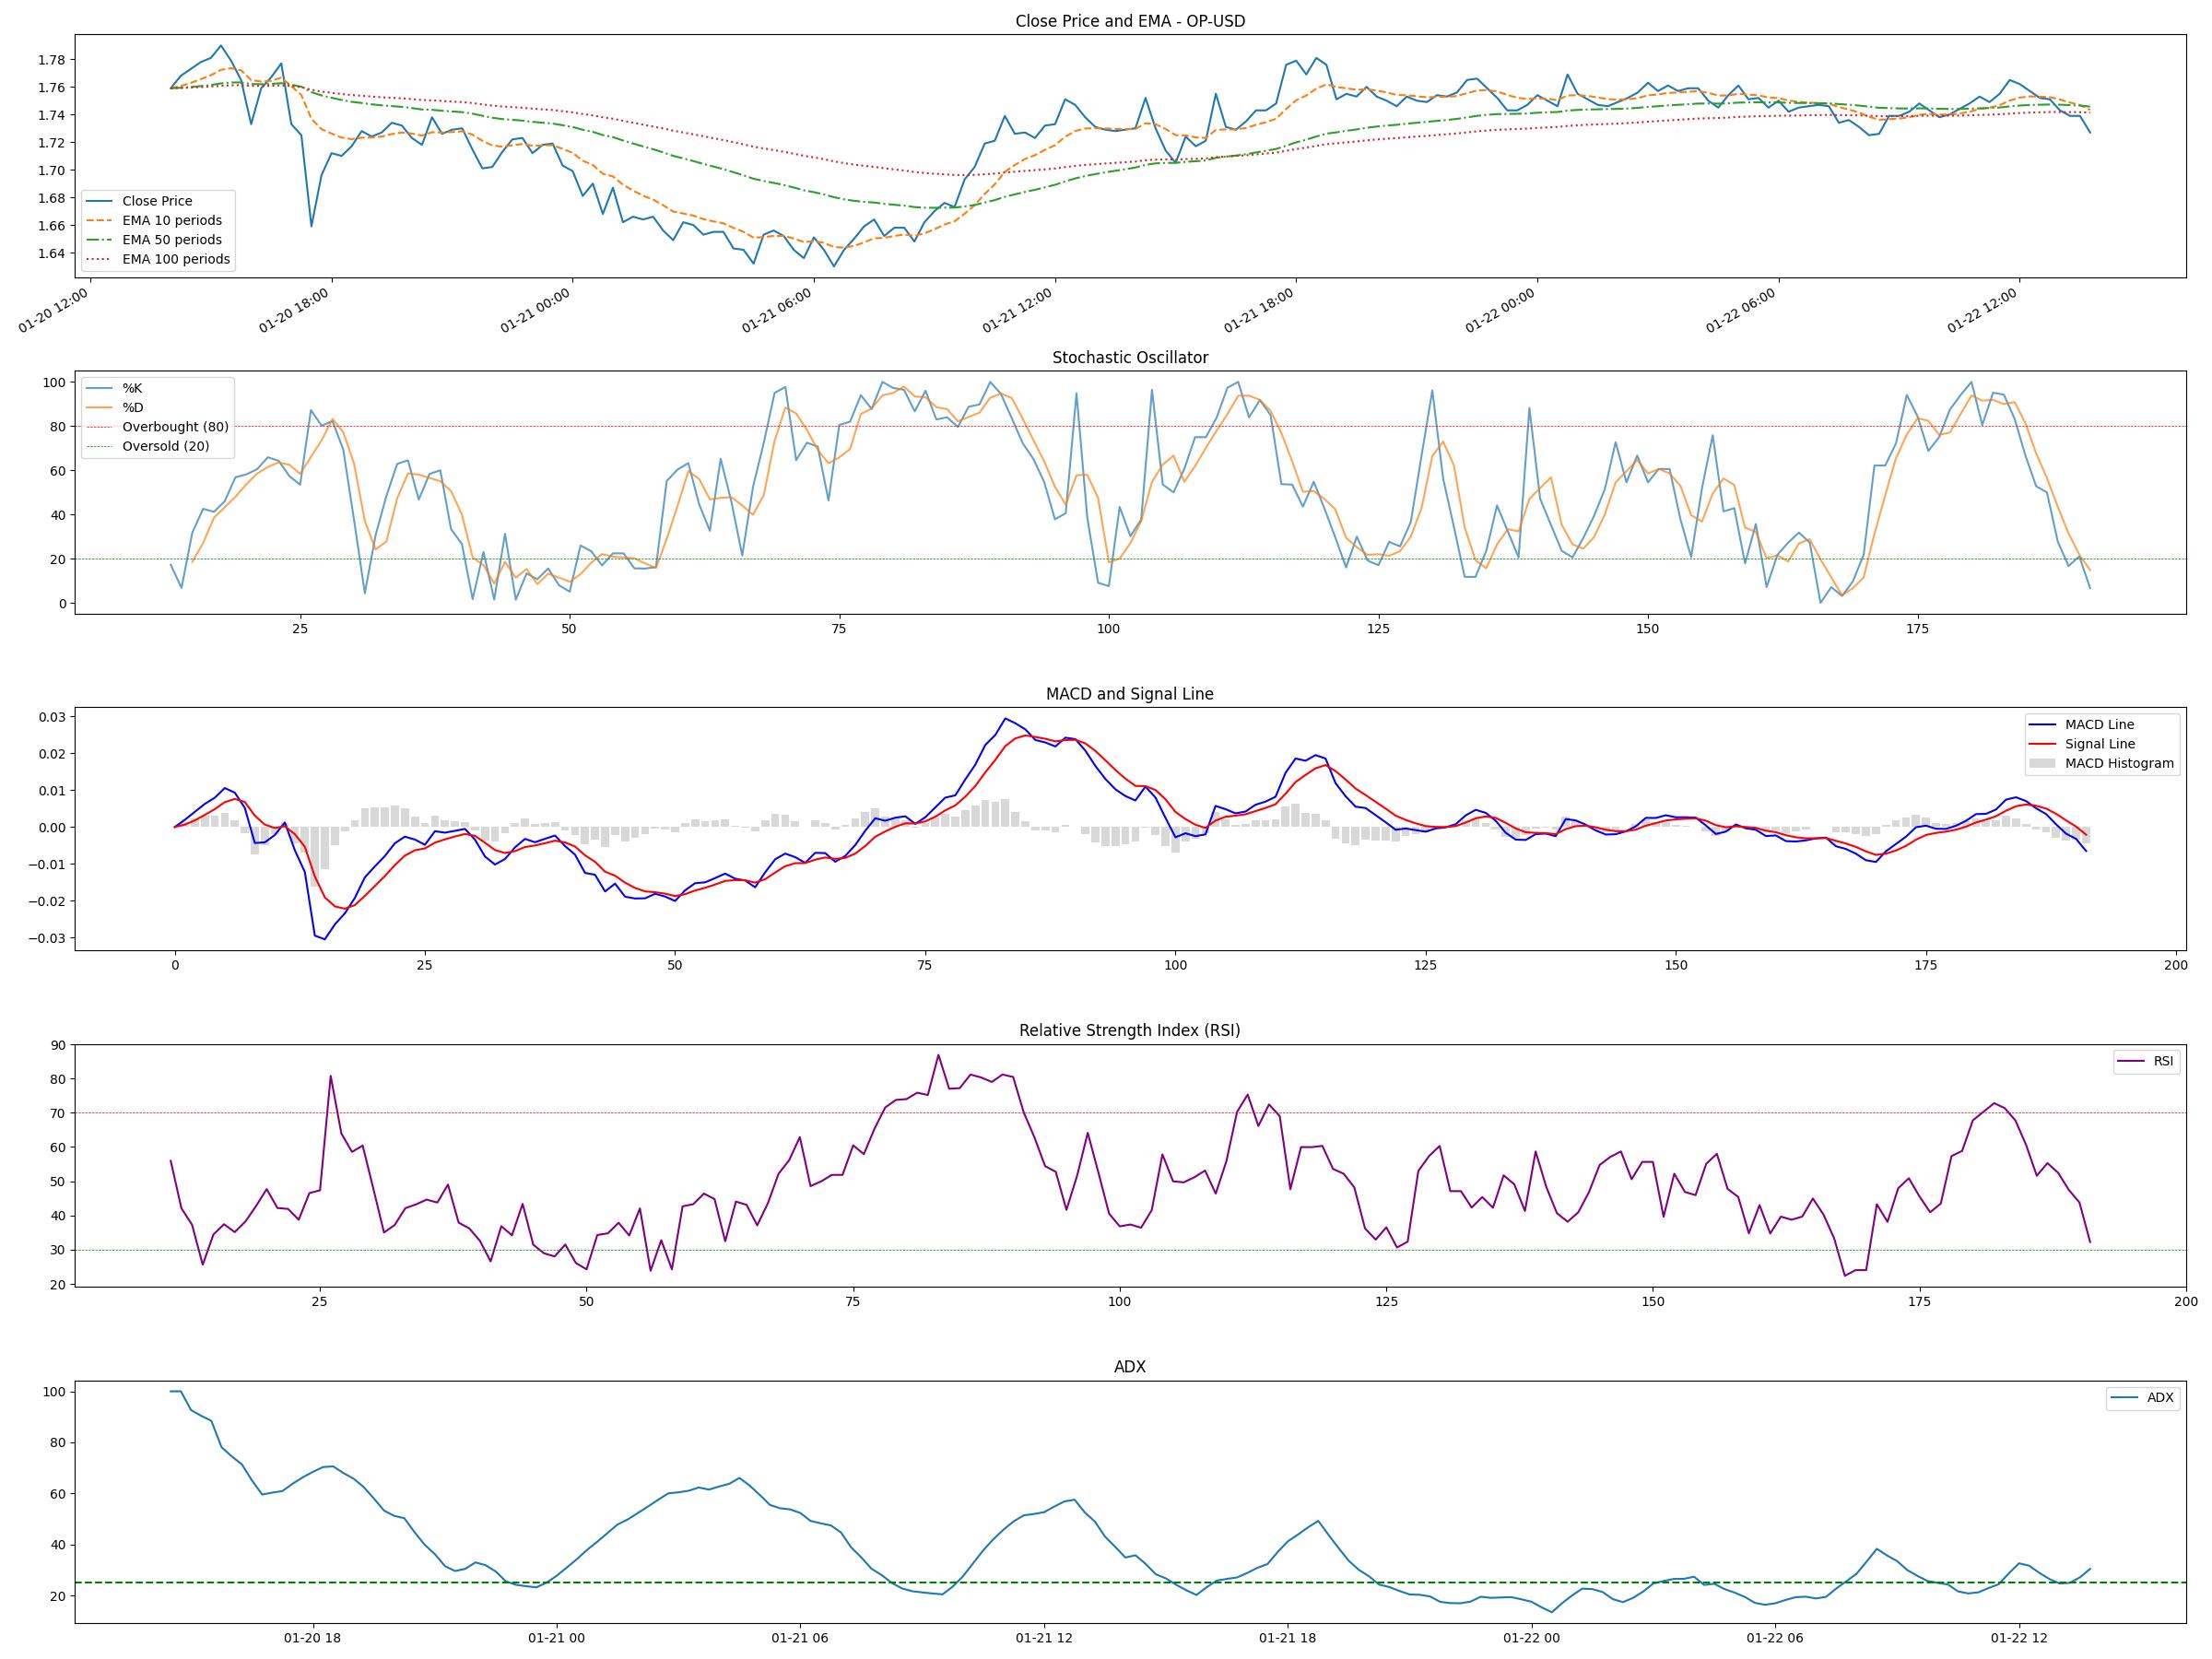
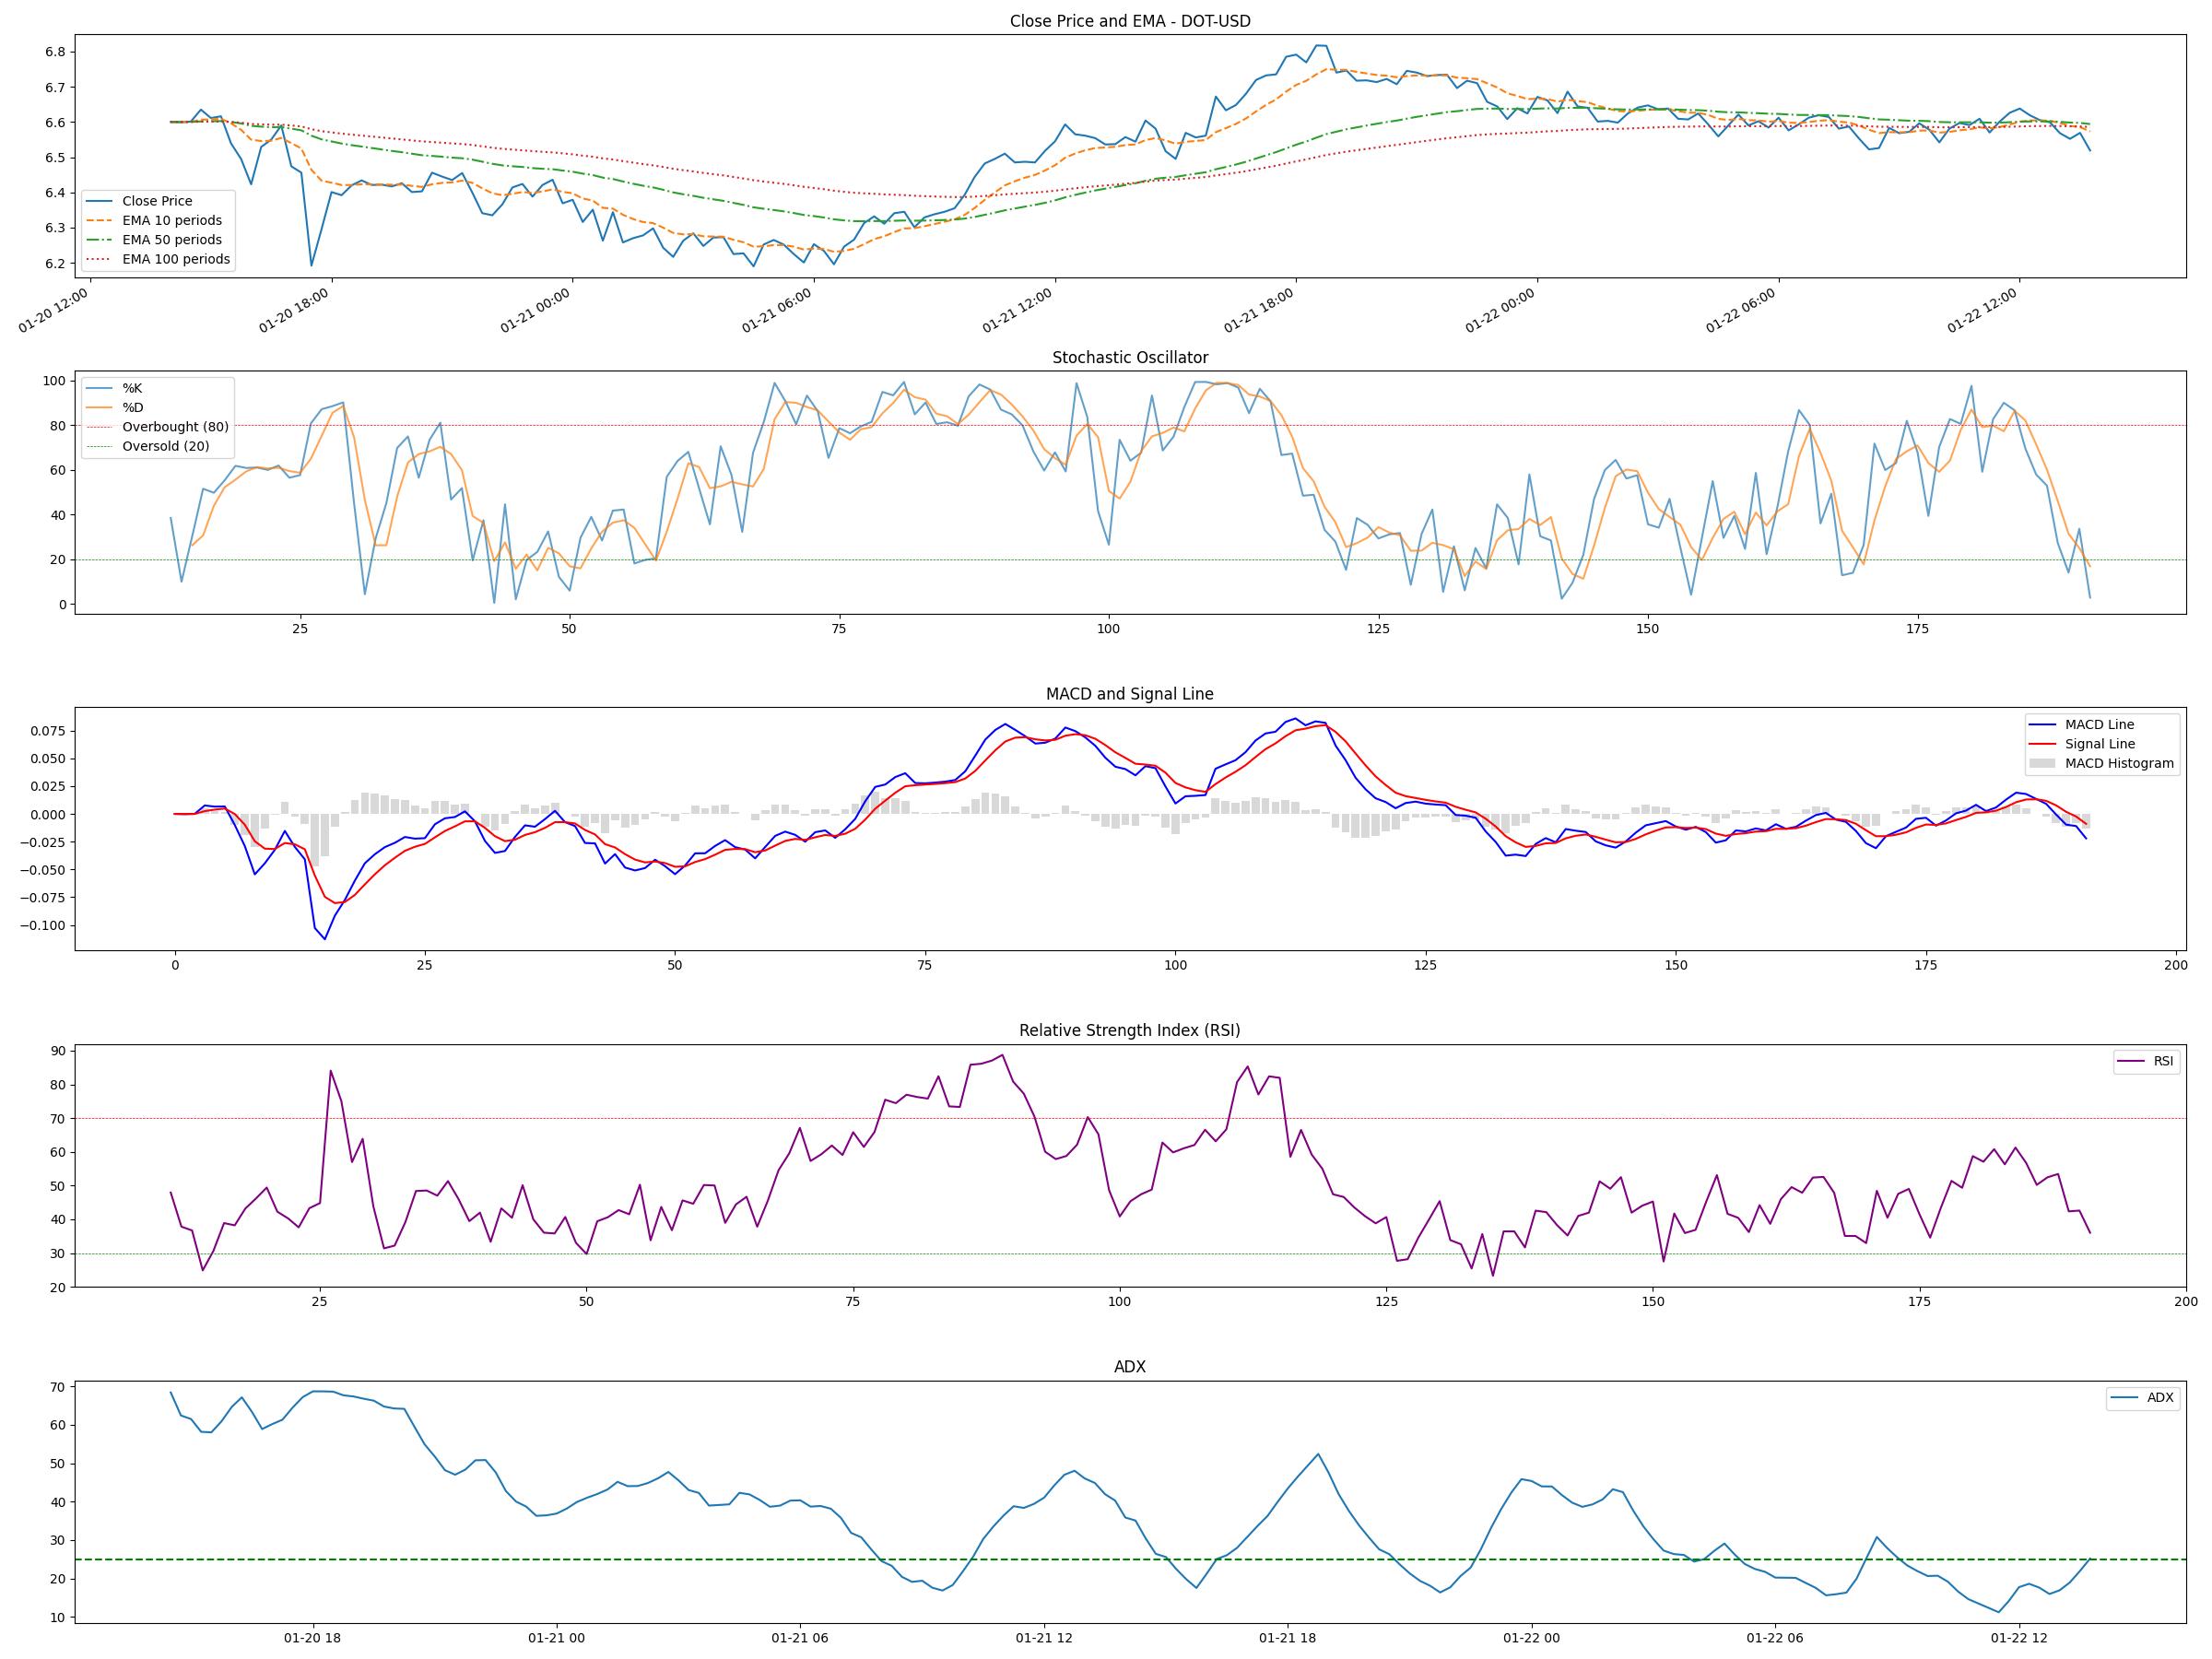
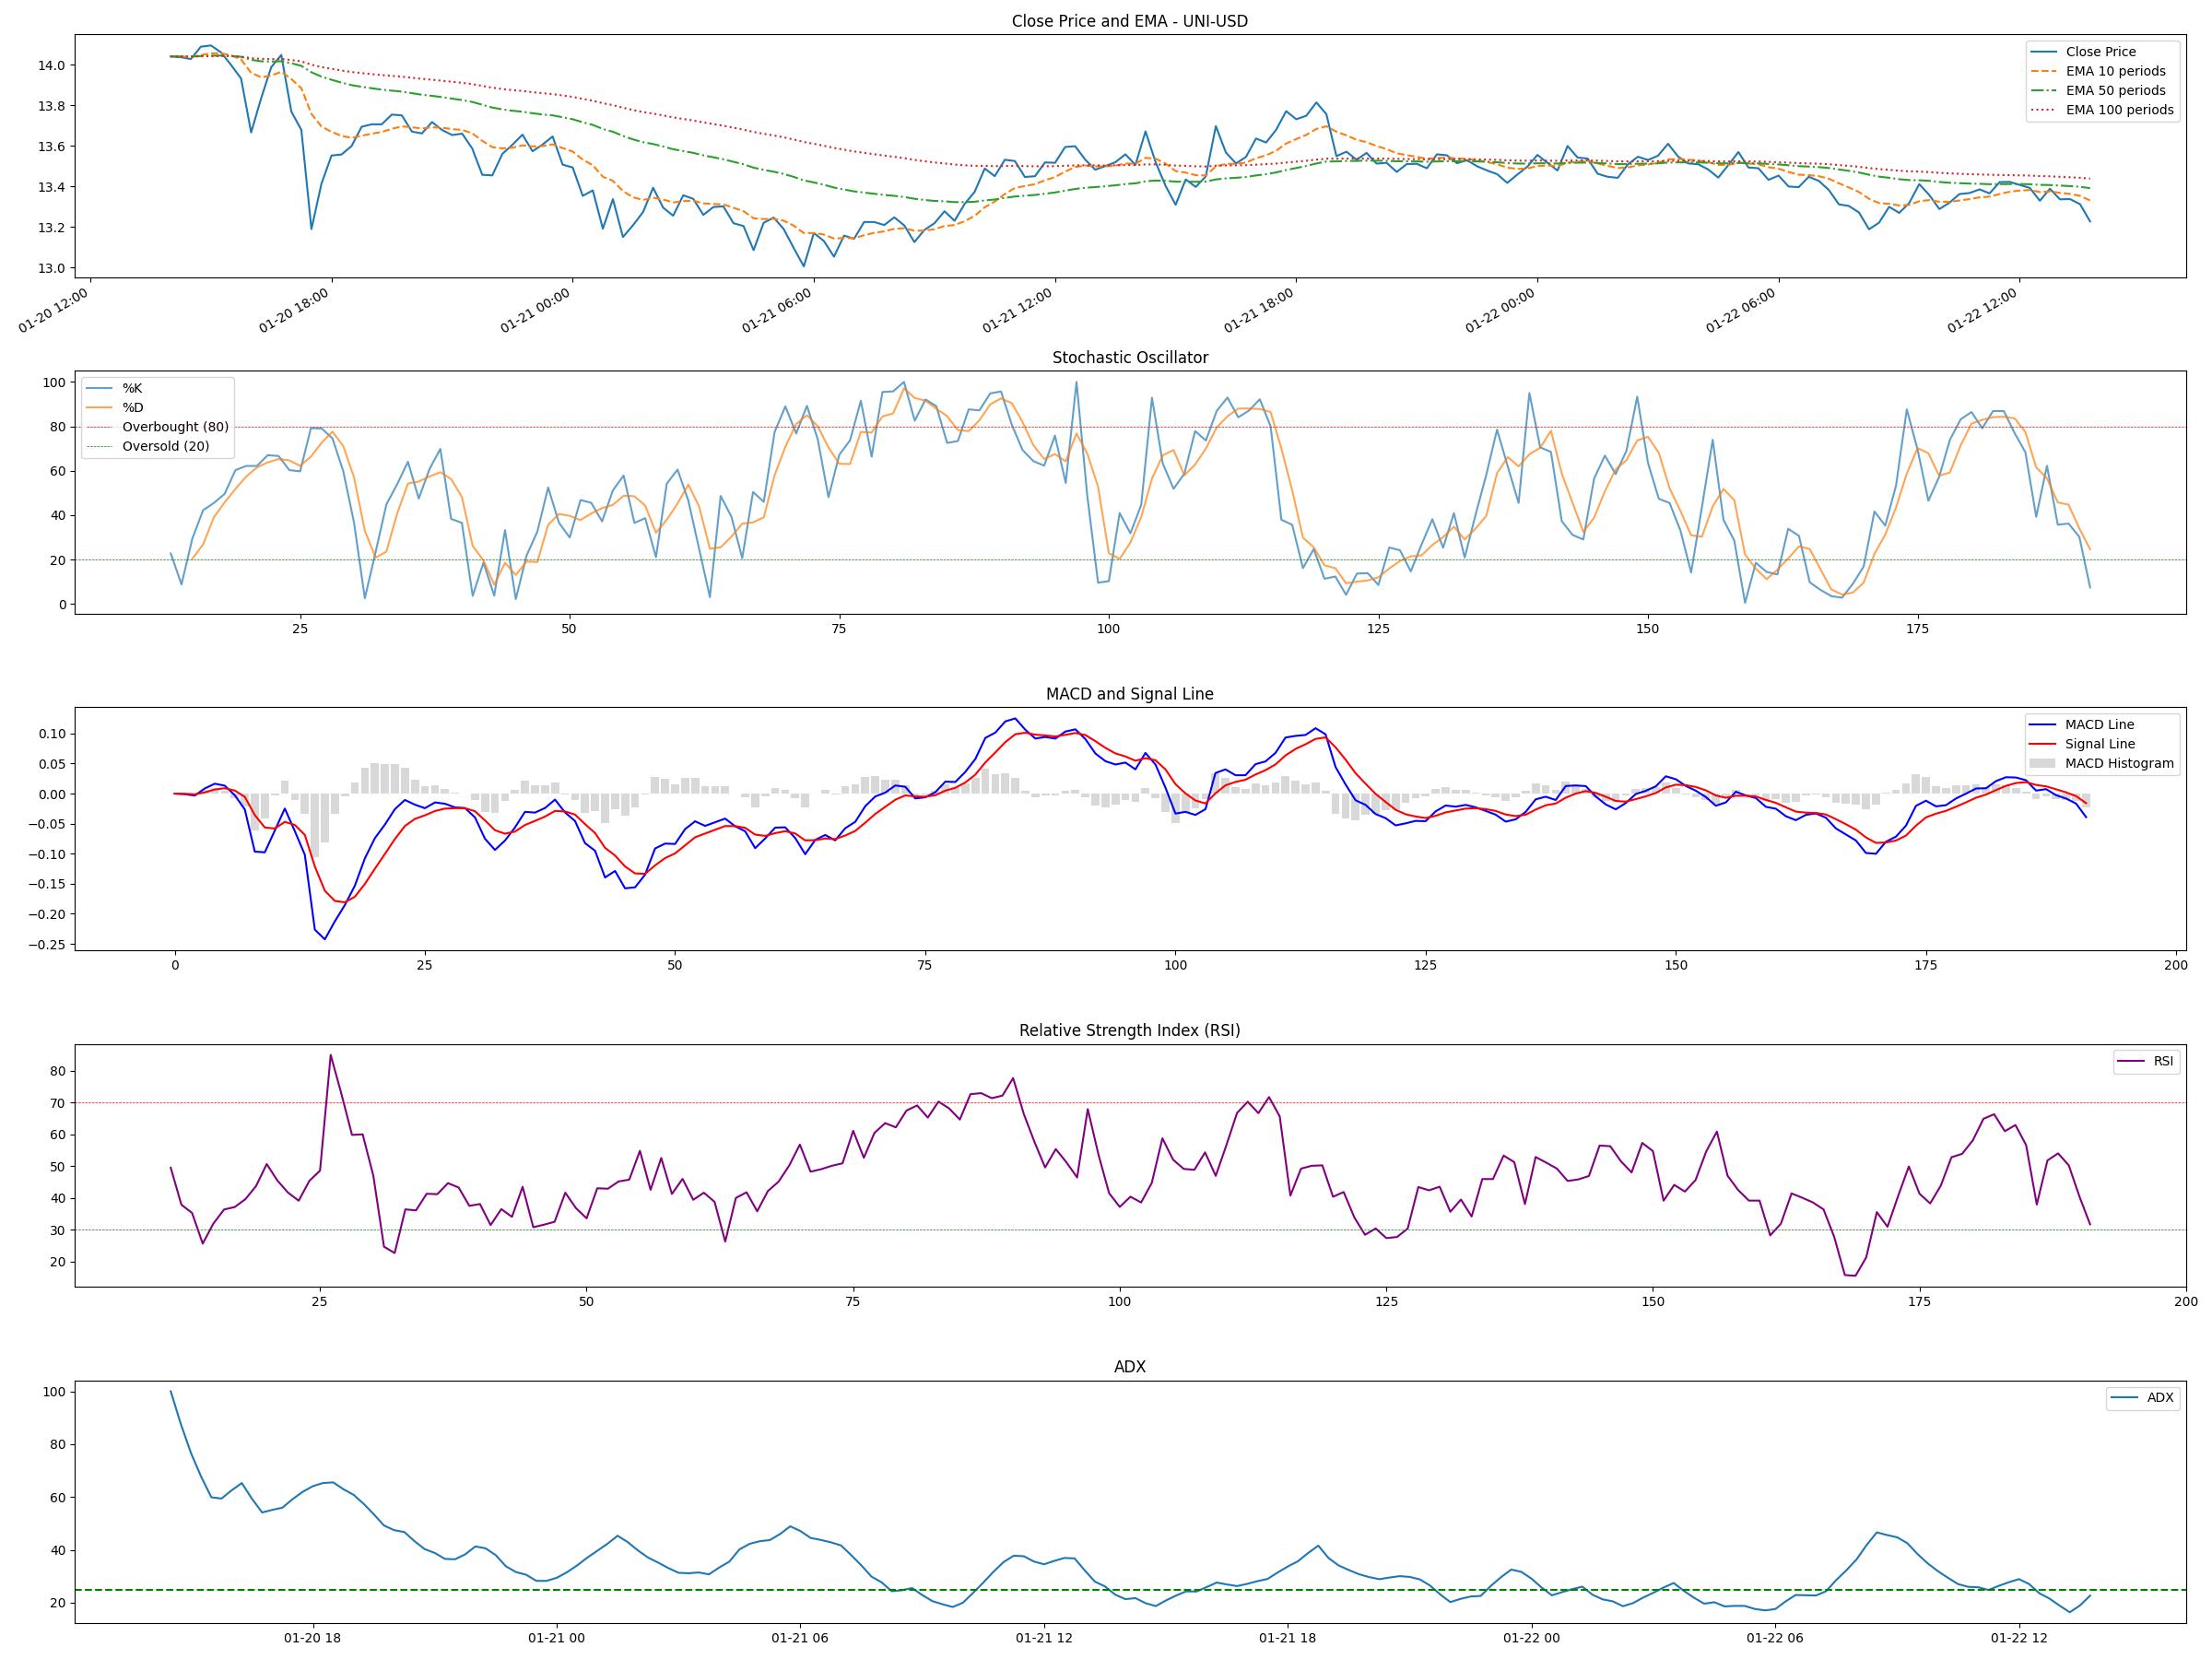
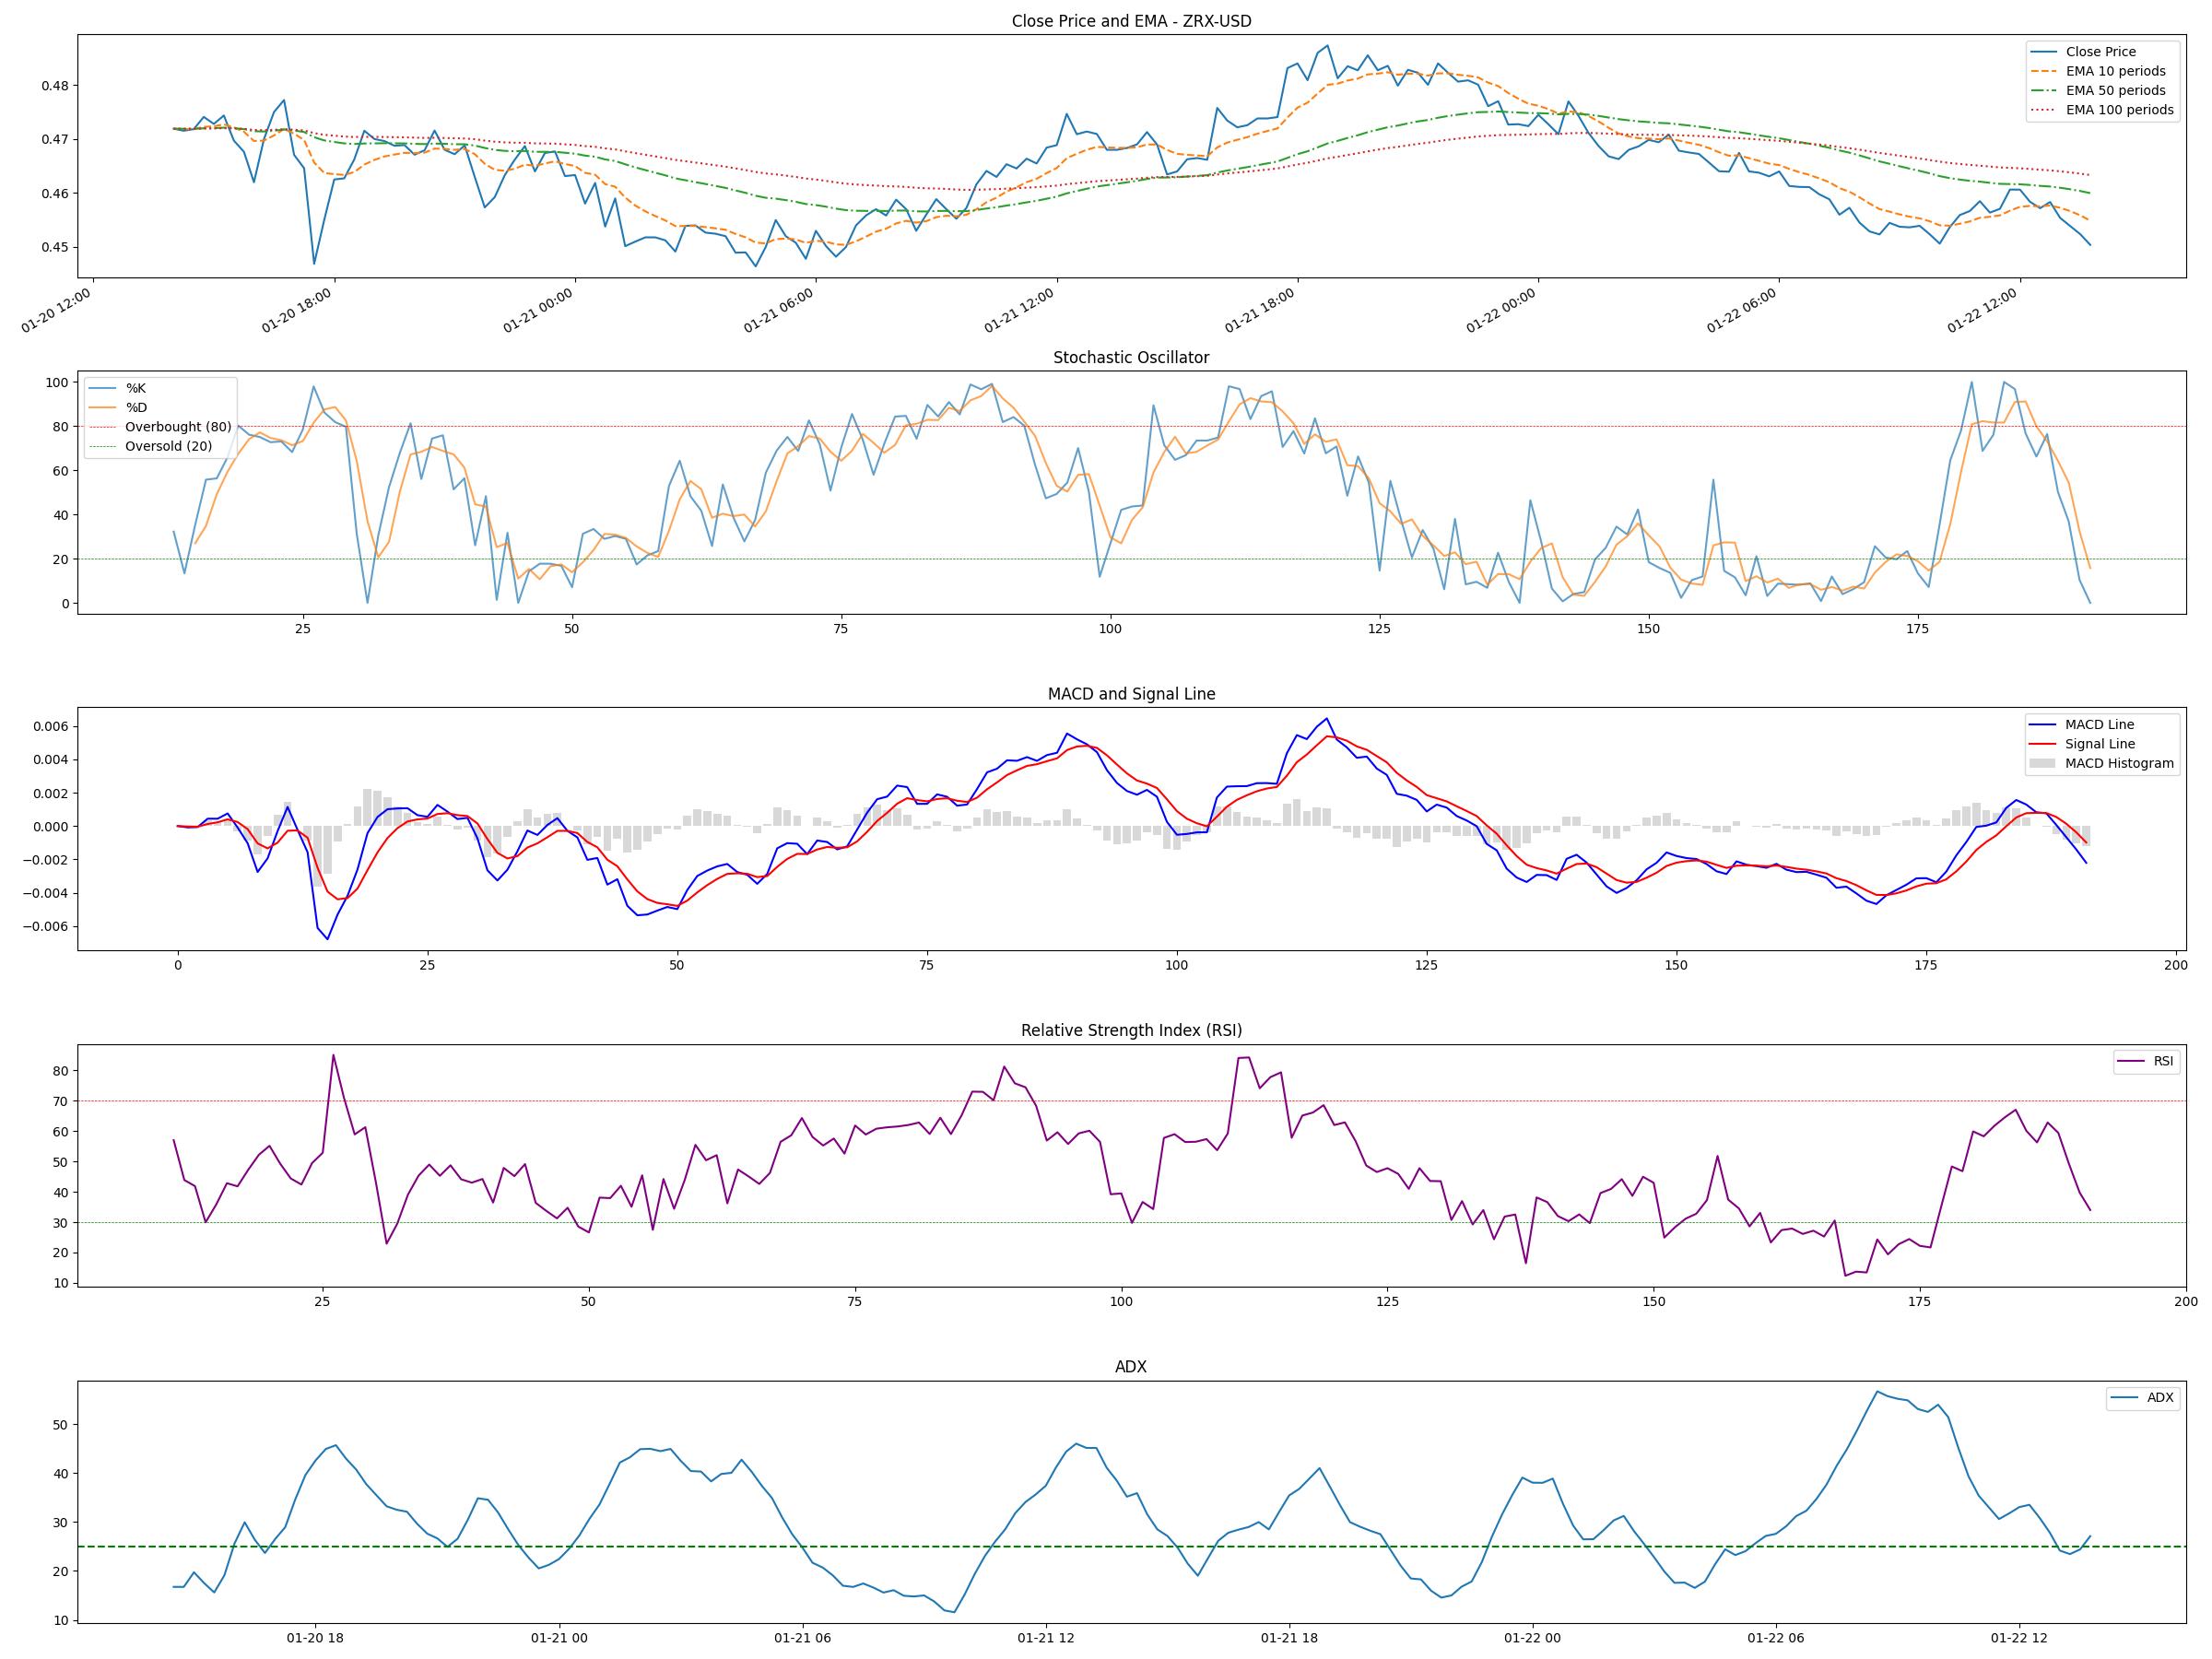
floor and ceiling prices of the asset. The relative strength index (RSI) calculation is based on vwap data. Its output values are in the
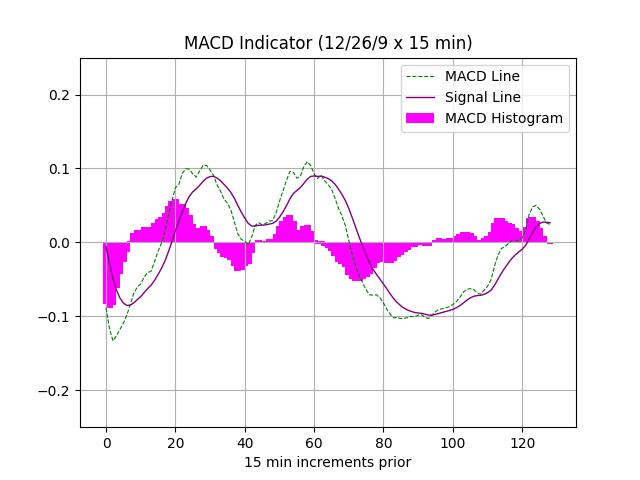
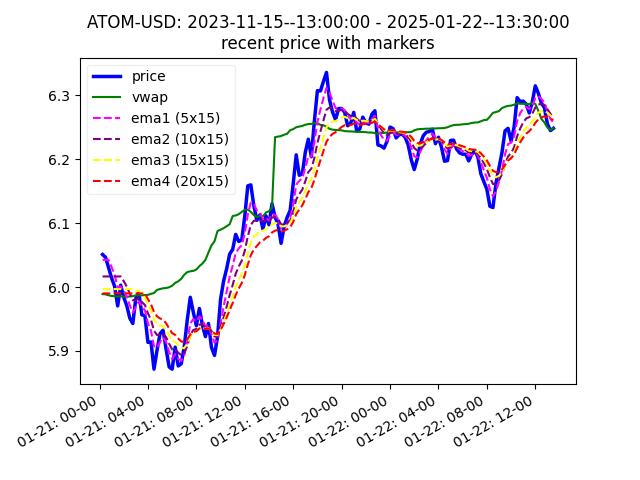
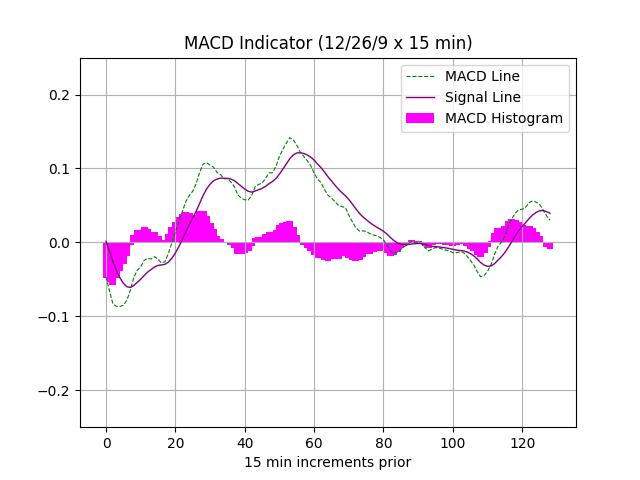
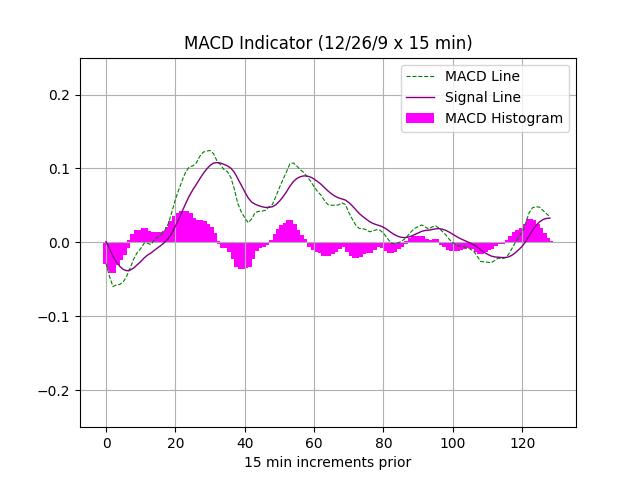
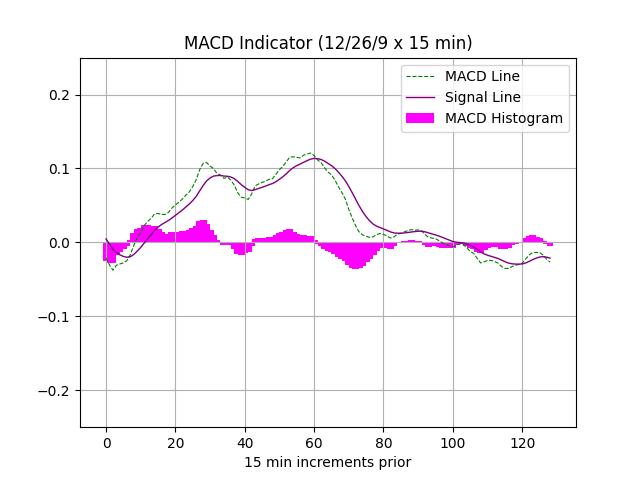
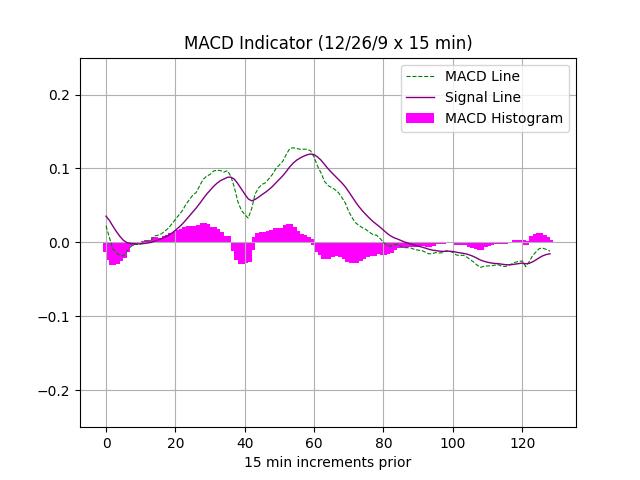
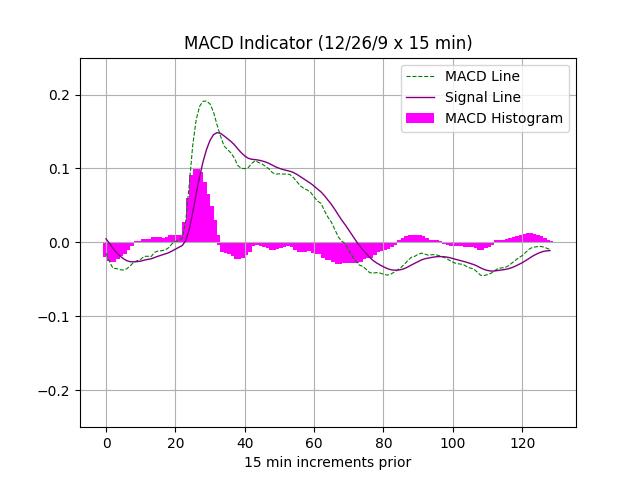
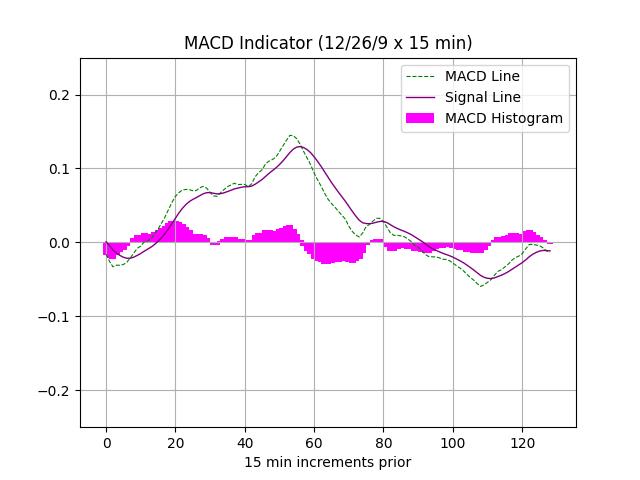
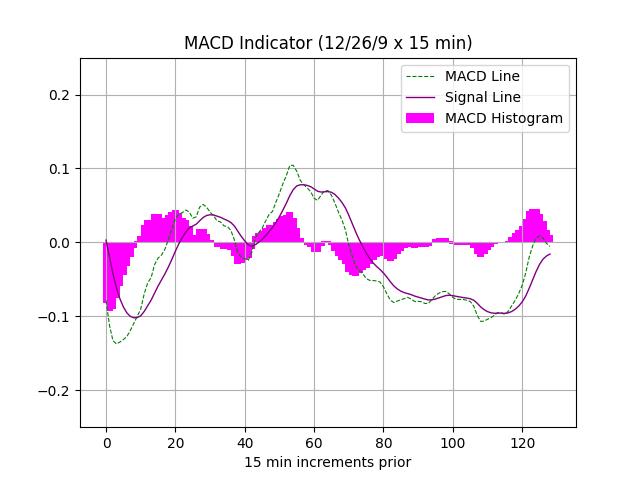
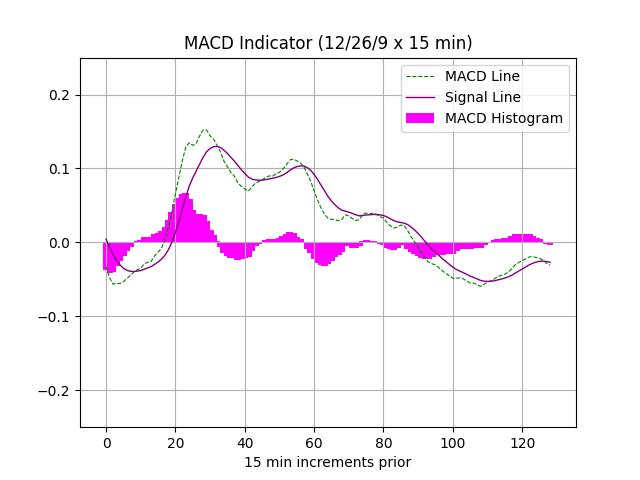
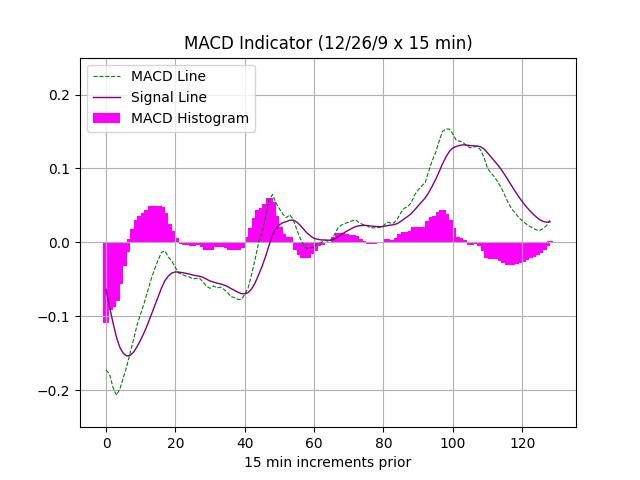
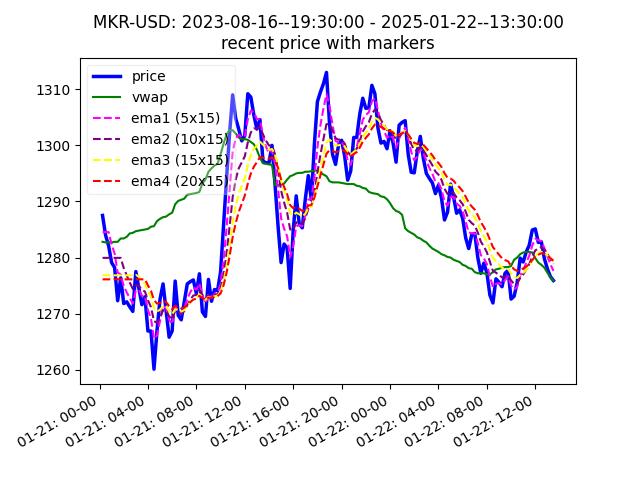
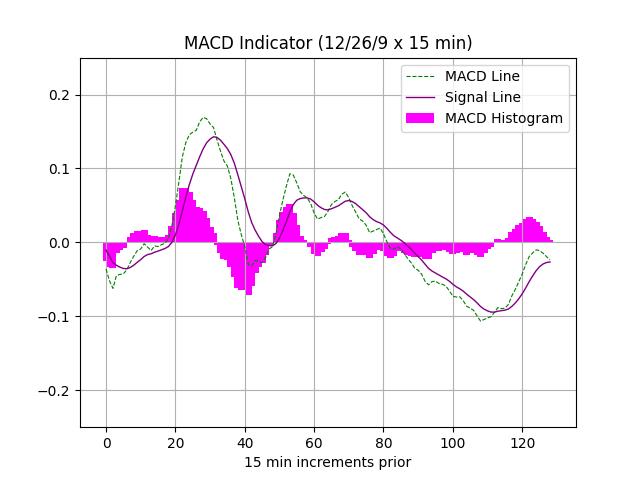
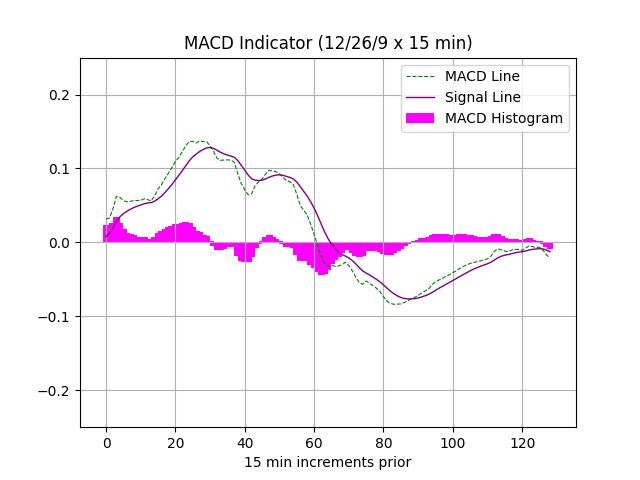
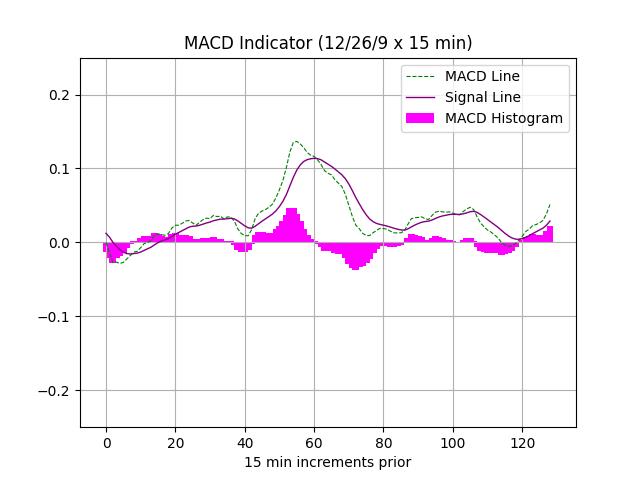
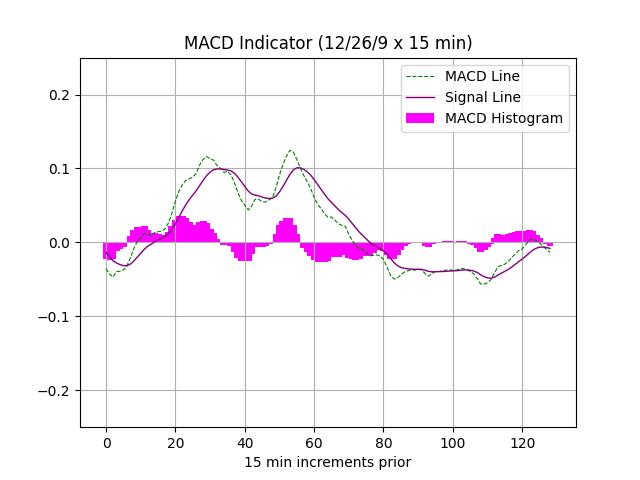
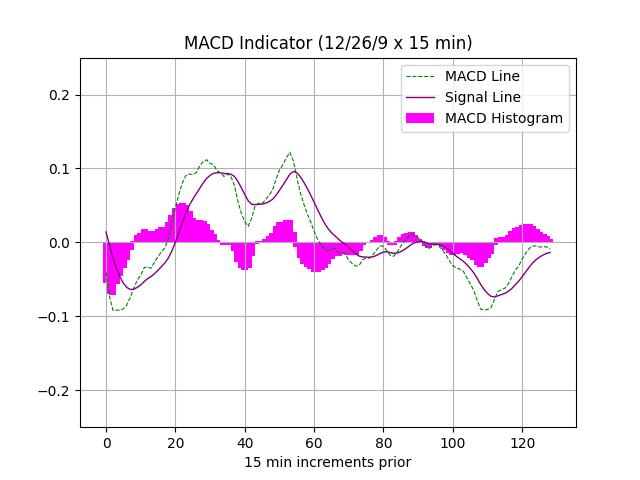
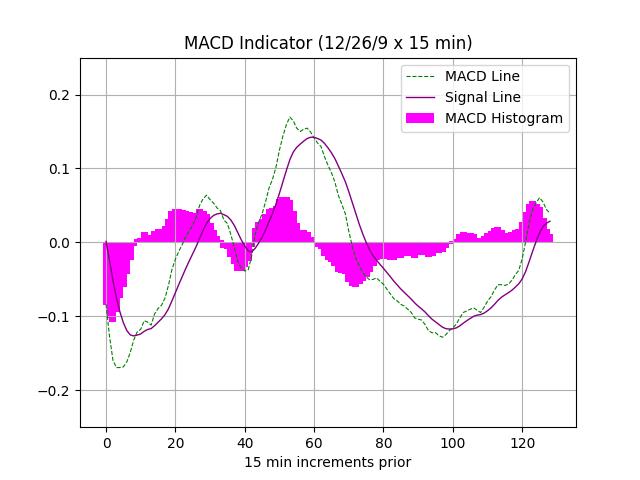
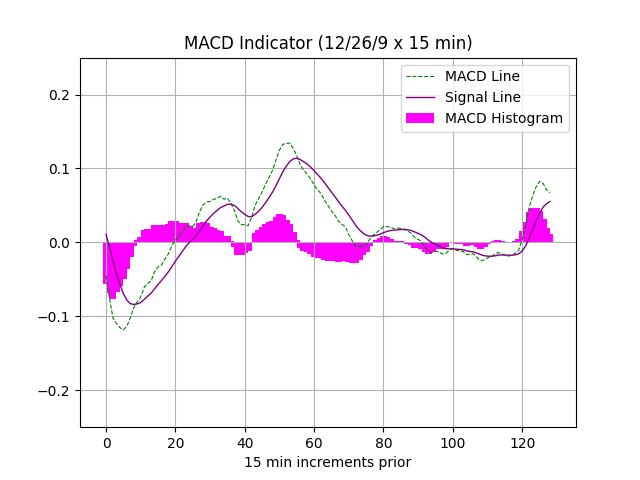
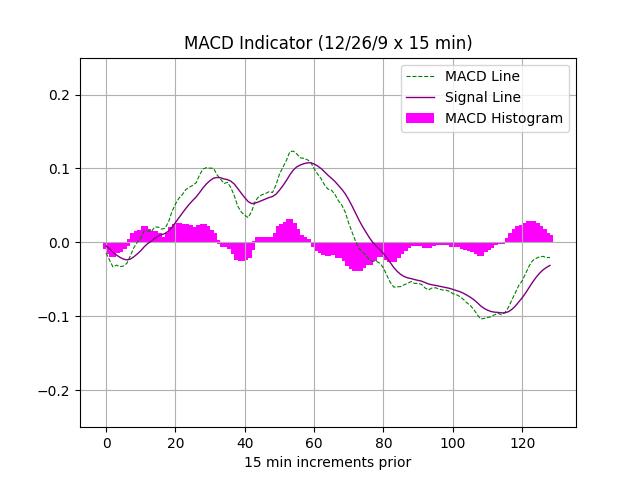
[0,100] interval. Rising values could indicate a potential prelude to a price increase. Also included, is the histogram and corresponding lines of the moving average convergence divergence (MACD) indicator for 12,26,9, 15-minute periods. The histogram visualizes the difference between the MACD and signal lines (9 x 15 min exponential moving average of the price curve). Positive values, together with increasing RSI, may signify an upward momentum in the asset price progression.
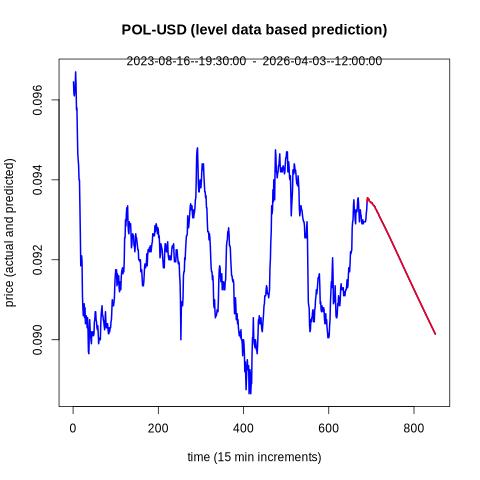
New: Added DOT and ATOM support, indicator plots, and results of models with Python and R based VAR model predictions for level set and differenced log data. Added lightGBM based BTC-USD and SOL-USD predictions and indicator computations for last three days of price and volume data. Merged previous MATIC-USD with newer POL-USD data. Updated predictors for key BTC, SOL, and XRP pairs.


 © 2026